Global Carbon Budget Report (Global Carbon Project)
The Global Carbon Budget is a yearly scientific report that tells the world how much carbon dioxide humans released in the past year, and where all that carbon went. It is prepared by the Global Carbon Project (GCP), an international network of scientists. You can think of it as the world's annual "account statement" for carbon: money in (our emissions) and where it was spent (into the air, the oceans and the land). It is released every year during the UN climate conference (COP), so negotiators have the latest numbers.
Why does it exist?
Governments make climate promises, but to check those promises, the world needs one trusted, independent count of emissions. National reports come late and use different methods. The Global Carbon Budget gives a single, science-based estimate that comes out within the same year, including a projection for the last months of the year. It also tracks the natural "sinks" (oceans, forests and soils that absorb CO2), which no single country measures on its own.
Where did it come from?
The Global Carbon Project was set up in 2001 by a partnership of four global science programmes: the International Geosphere-Biosphere Programme (IGBP), the International Human Dimensions Programme on Global Environmental Change (IHDP), the World Climate Research Programme (WCRP) and Diversitas. This partnership later became Future Earth, and the GCP is now a research project of Future Earth and a research partner of the WCRP. The yearly carbon budget began in the mid-2000s; the 2025 edition was the 20th.
The report is led by Pierre Friedlingstein of the University of Exeter (UK), and it is published in the scientific journal Earth System Science Data. Besides the carbon budget, the GCP also publishes global budgets for methane and nitrous oxide.
How does the carbon "account" work?
The report balances a simple equation. All the CO2 humans release must end up somewhere:
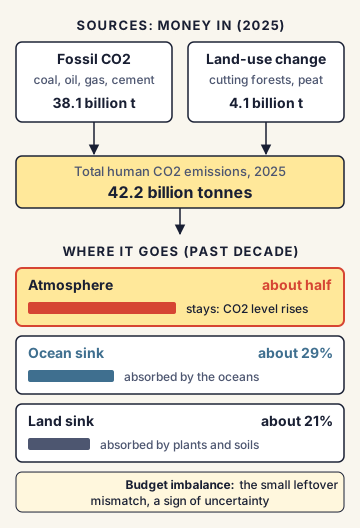
- Sources (money in):
- Fossil CO2 emissions: from burning coal, oil and gas, and from making cement.
- Land-use change emissions: from cutting forests, draining peatlands and changing land use, minus regrowth.
- Where it goes (money spent):
- Atmosphere: the part that stays in the air and raises the CO2 concentration.
- Ocean sink: the part the oceans absorb.
- Land sink: the part plants and soils absorb.
- Budget imbalance: the small leftover mismatch, which shows how uncertain the estimates are.
Over the past decade, the land absorbed about 21% of human CO2 emissions and the ocean about 29%. Roughly half stayed in the atmosphere, which is why CO2 levels keep rising.
How do scientists get the numbers?
Fossil emissions come from national energy data, adjusted with the latest fuel use figures for the current year. Land-use emissions come from bookkeeping models, which track carbon lost when a forest is cut and gained when it regrows. Ocean and land sinks come from many computer models checked against real measurements. Atmospheric CO2 comes from monitoring stations around the world.
What did recent editions find?
The 2025 edition (released at COP30 in Belém, Brazil) found:
- Fossil CO2 emissions hit a record of about 38.1 billion tonnes in 2025, up about 1.1%.
- Land-use change emissions were about 4.1 billion tonnes, so total CO2 emissions were about 42.2 billion tonnes.
- Atmospheric CO2 reached about 425.7 ppm (parts per million) in 2025, around 52% above pre-industrial levels.
- The remaining carbon budget for 1.5°C was about 170 billion tonnes of CO2, roughly four years of emissions at 2025 levels.
- India's fossil CO2 emissions rose about 1.4% in 2025, much slower than the roughly 4% rise in 2024.
- A companion study found that about 8% of the rise in atmospheric CO2 since 1960 is because climate change is weakening the land and ocean sinks.
India's position and Indian examples
India is the world's third-largest emitter of fossil CO2 in total, after China and the United States, but its emissions per person are far below the world average. The Global Carbon Budget shows both the total and per-person picture, and India uses the per-person and historical numbers to argue for equity in climate talks. Indian research bodies take part in global carbon monitoring, but India's official emissions figures come from its own reports to the UNFCCC, such as the Biennial Update Reports.
Commonly confused concepts
- Global Carbon Budget (report) vs carbon budget (concept): the report is the yearly emissions count. The "carbon budget" concept means the total CO2 the world can still emit to stay below a temperature limit. The report calculates the remaining budget, but they are not the same thing.
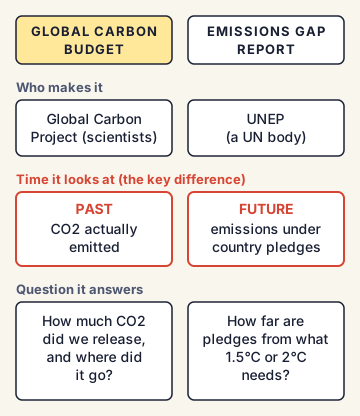
- Global Carbon Budget vs UNEP Emissions Gap Report: the Global Carbon Budget counts what was actually emitted and where it went. The Emissions Gap Report (by UNEP) compares future emissions under countries' pledges with what is needed for 1.5°C or 2°C.
- Global Carbon Project vs IPCC: the GCP is a research network that publishes yearly data. The IPCC (Intergovernmental Panel on Climate Change) is a UN body that reviews all published science in large assessment reports every several years.
- CO2 emissions vs CO2 concentration: emissions are the yearly amount released (in tonnes). Concentration is how much CO2 is in the air (in ppm). Concentration keeps rising as long as emissions are above what sinks can absorb, even if emissions fall a little.
Issues, criticism and the way forward
- Uncertainty in land numbers: land-use emissions and land sinks are the hardest to measure. A 2026 study by the GCP team found the natural land sink is smaller than earlier thought, and land-use emissions are larger.
- Different from national figures: the GCP's land-use figures differ from what countries report, mainly because they define "human-caused" land carbon differently.
- Short-term dips can mislead: a one-year fall caused by a crisis is not a lasting trend. Scientists check the type and timing of the fall (for example, a sudden drop in oil) to judge whether it comes from real structural change.
- Way forward: scientists call for better satellite and ground monitoring of forests and oceans, and for linking global estimates with national inventories so that the numbers can be compared fairly.
Concepts to Know
- Carbon sink: anything that absorbs more CO2 than it releases, such as oceans, forests and soils.
- ppm (parts per million): a unit for concentration. 425 ppm means that out of every million molecules of air, about 425 are CO2.
- Pre-industrial: the period before large-scale burning of coal, usually taken as about 1850 to 1900. It is the baseline for measuring warming.
- Bookkeeping model: a model that keeps an account of carbon lost when land is cleared and carbon gained when vegetation regrows, year by year.
- Projection: an estimate for the months of the year that have not yet ended, based on data so far and expected trends.
- Global Carbon Project set up: 2001; now a project of Future Earth, partner of WCRP.
- Report published yearly in Earth System Science Data; released at every COP.
- 2025 edition was the 20th; lead author Pierre Friedlingstein (University of Exeter).
- 2025: fossil CO2 about 38.1 billion tonnes (record); land-use change 4.1 billion tonnes; atmospheric CO2 425.7 ppm.
- Remaining 1.5°C budget (2025 edition): about 170 billion tonnes CO2, about 4 years.
- Past decade: ocean absorbed about 29%, land about 21% of human CO2 emissions.
● Tracked since November 10, 2026 · last seen November 10, 2026 · updates as the daily brief publishes