Purchasing Power Parity (PPP)
Nominal GDP vs PPP Rankings
Purchasing power parity (PPP) is a way of comparing the size of economies, or the living standards of people, after adjusting for the fact that the same money buys different amounts in different countries. A haircut, a plate of food or a bus ride costs much less in India than in the US. If we simply convert India's GDP into dollars at the market exchange rate, we undercount how much India actually produces.
PPP corrects this by valuing every country's output at common prices. That is why India is the world's fourth or fifth largest economy in nominal terms, but the third largest in PPP terms.
Why do we need it?
Suppose a cup of tea costs ₹20 in Delhi and $2 in New York. At a market exchange rate of, say, ₹85 per dollar, $2 is about ₹170. So the same cup of tea "costs" eight times more in New York. If we measure India's economy at market exchange rates, every cup of tea made in India counts as only about $0.24, while the same cup in New York counts as $2.
Real output is the same, but India's number looks much smaller. PPP asks a fairer question: how much would all of India's goods and services be worth if they were priced the way they are priced in the US?
PPP also matters because market exchange rates move for reasons that have nothing to do with how much a country produces: interest rates abroad, oil prices, investor mood and capital flows. A sudden fall in the rupee would make India's nominal dollar GDP look smaller overnight, even though Indians produced exactly the same goods. PPP is much more stable.
Where did the idea come from?
- The basic idea is old, but the Swedish economist Gustav Cassel gave it its modern form around 1916-1918, after the First World War had disturbed currency values. He suggested that exchange rates between currencies should, in the long run, move to equal the ratio of their price levels.
- PPP is built on the law of one price: in a world with no transport costs or trade barriers, the same good should cost the same everywhere once prices are converted into one currency. If a pen were much cheaper in country A, traders would buy it there and sell it in country B until the prices became equal.
- In 1968, the International Comparison Program (ICP) was started (initially with the UN and the University of Pennsylvania) to collect prices across countries and calculate PPPs scientifically. It is now coordinated by the World Bank.
- In 1986, the magazine The Economist created the Big Mac Index, a simple, light-hearted test of PPP that compares the price of a McDonald's Big Mac burger across countries.
How are PPPs calculated, step by step?
- Collect prices: In each round of the ICP, national statistics offices collect prices of a large, common basket of comparable goods and services: food, clothes, rent, transport, health, education, machinery, construction and so on. In India, this work is done by MoSPI.
- Compare prices: For each item, the price in each country is compared with the price in a reference country (usually the US).
- Calculate the PPP rate: These comparisons are combined into one conversion rate per country. For example, if the whole basket costs ₹20 in India for every $1 it costs in the US, India's PPP conversion rate is about ₹20 per international dollar (an illustrative number), even if the market rate is about ₹85 per dollar.
- Convert GDP: India's GDP in rupees is divided by the PPP rate, not the market exchange rate. The result is GDP in "international dollars": an imaginary currency that buys the same amount in every country as one US dollar buys in the US.
A simple example
Suppose India's GDP is ₹340 lakh crore.
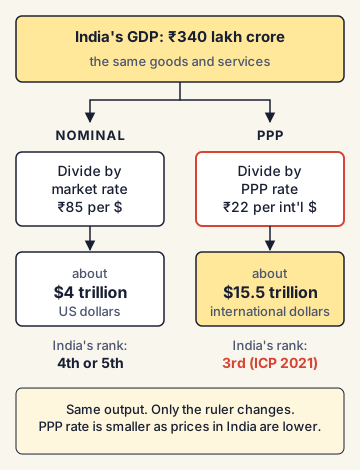
- At a market rate of ₹85 per dollar: ₹340 lakh crore ÷ 85 = about $4 trillion (nominal GDP).
- At an illustrative PPP rate of ₹22 per international dollar: ₹340 lakh crore ÷ 22 = about $15.5 trillion (PPP GDP).
The output is the same. Only the "ruler" used to measure it is different.
Why are prices lower in poorer countries? The Balassa-Samuelson effect
Many services, such as haircuts, housework, local transport and restaurant meals, cannot be traded across borders. Their prices depend on local wages. Wages are low in developing countries because overall productivity is lower. So these services are much cheaper there. Market exchange rates are mainly set by traded goods and money flows, so they miss this. As a result, the PPP-based GDP of a developing country is usually much bigger than its nominal GDP, while for rich countries the two are close.
The key facts and numbers
- ICP 2021 round (results released by the World Bank in 2024): world GDP in PPP terms was about $152.4 trillion. The top three were China (about $28.8 trillion, 18.9%), the United States (about $23.6 trillion, 15.5%) and India (about $11.0 trillion, 7.2%). After India came Russia, Japan, Germany, Brazil and France.
- The IMF publishes both nominal and PPP-based GDP for nearly every country in its World Economic Outlook database. It uses PPP weights to calculate world growth, because market-rate weights would give too much importance to rich countries.
- In nominal terms (market exchange rates), the IMF's October 2026 projections put India at about $4.52 trillion in 2027, overtaking Japan to become fourth, after the US, China and Germany.
- Per head, India is still a lower-middle-income country. Even in PPP terms, India's GDP per person is far below the world average, because the total is shared among more than 140 crore people.
Uses of PPP and nominal GDP: which one to use when?
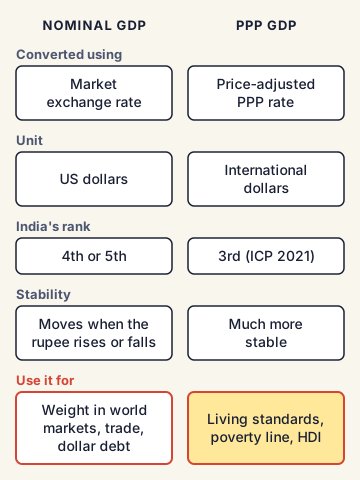
- Use nominal (market exchange rate) GDP to measure a country's weight in international markets: how much it can import, how big its debt is in dollars, how much foreign investors see, and its share in global trade. Most news about "the fourth-largest economy" uses nominal GDP.
- Use PPP GDP to compare living standards, real output and poverty across countries. The World Bank's international poverty line is set in PPP dollars. The Human Development Index (HDI) of the UNDP uses Gross National Income per person in PPP terms. The IMF's quota formula (which decides voting power) also gives some weight to PPP-based GDP.
India's position and Indian examples
- India has taken part in ICP rounds and MoSPI collects the price data used for India's PPP estimates.
- India's large gap between nominal and PPP GDP reflects its low prices for services and housing compared with rich countries.
- The international poverty line of the World Bank (in PPP dollars per person per day) is used to measure extreme poverty in India and compare it with other countries.
- In India, GDP itself is measured by the National Statistics Office (NSO) under MoSPI. The new GDP series with base year 2022-23 was released on 27 February 2026. Any change in India's rupee GDP (such as from a base year revision) changes both its nominal and PPP dollar GDP.
Commonly confused concepts
- Nominal GDP vs real GDP: This is about time, not countries. Nominal GDP is measured at current prices, so it rises with both more output and higher prices. Real GDP is measured at constant prices of a base year (2022-23 in India's new series), so it shows only the change in actual output. Growth rates like "7.8%" are real GDP growth.
- Nominal GDP in dollars vs PPP GDP: This is about comparing countries. Nominal dollar GDP uses the market exchange rate. PPP GDP uses a price-adjusted conversion rate. A country can be fourth in one ranking and third in the other.
- PPP vs REER: The Real Effective Exchange Rate (REER) tracks whether a currency is becoming more or less competitive against a group of trading partners over time, after adjusting for inflation. PPP is used to compare price levels and the size of economies at one point in time.
- International dollar vs US dollar: An international dollar is a unit of measurement, not a real currency. It has the same buying power in every country as a US dollar has in the United States.
- Total GDP vs GDP per capita: A country with a huge population (India, China) can have a large total GDP but a low GDP per person. Living standards depend on the per person number.
Issues, criticism and the way forward
- Price collection is hard: Comparing truly identical goods and services across very different countries (for example, a government school in India and one in Norway) is difficult. Results can change a lot between ICP rounds. After the 2005 round, for example, the PPP-based GDP estimates of China and India were cut sharply.
- ICP rounds are years apart: In between rounds, PPPs are estimated by extrapolation, using inflation differences. These estimates can drift away from reality.
- The law of one price often fails: Transport costs, taxes, trade barriers and non-traded services mean prices never fully equalise. That is why PPP is a long-run tendency for exchange rates, not a short-run prediction.
- Quality differences: A service may have the same name but different quality in two countries. If quality is not adjusted properly, comparisons can mislead.
- Choosing the right measure in debates: Some argue that rankings based on nominal GDP understate developing economies, while others argue that PPP figures overstate their global buying power. Most experts suggest using both, each for its own purpose, and always checking the per person figure.
- Way forward: more frequent ICP rounds, better quality adjustments for services, and stronger national price statistics.
Concepts to Know
- GDP (Gross Domestic Product): The total value of all final goods and services produced inside a country in a year.
- Exchange rate: The price of one currency in terms of another. For example, how many rupees you need to buy one US dollar.
- Market exchange rate: The exchange rate set every day by buying and selling of currencies in the foreign exchange market.
- Base year: The year whose prices are used as a fixed reference to measure real growth. India's new GDP series uses 2022-23.
- Traded vs non-traded goods: Traded goods (phones, cars, oil) can be bought and sold across borders. Non-traded goods and services (haircuts, rent, local bus rides) must be consumed where they are produced.
- Per capita: "Per person". GDP per capita is total GDP divided by the population.
- Extrapolation: Estimating new values by extending a known trend, when fresh data are not available.
- Modern PPP theory: Gustav Cassel, around 1916-1918; based on the law of one price
- International Comparison Program (ICP): started 1968; now coordinated by the World Bank
- Big Mac Index: The Economist, 1986
- ICP 2021 (results released in 2024): world PPP GDP about $152.4 trillion; China 18.9%, US 15.5%, India 7.2% (about $11.0 trillion, third largest)
- PPP GDP is measured in international dollars
- HDI uses GNI per capita (PPP); World Bank poverty line is in PPP dollars
- IMF uses PPP weights to calculate world growth in the WEO
- IMF projection (October 2026): India nominal GDP about $4.52 trillion in 2027, overtaking Japan to become 4th
● Tracked since October 15, 2026 · last seen October 15, 2026 · updates as the daily brief publishes