Output Gap
Is the Economy Running Too Hot or Too Cold?
The output gap is the difference between what an economy is actually producing and what it could produce at full, normal capacity without pushing up inflation. The "could produce" level is called potential output or potential GDP. The gap is usually shown as a percentage of potential output. A positive gap means the economy is running "too hot" and prices tend to rise faster. A negative gap means it is running "too cold", with idle factories and workers.
Why does it matter?
Think of a car engine. It has a safe top speed. You can push it above that for a while, but it heats up. If you drive far below it, you waste the engine's power. An economy is similar. If demand pushes production above potential, firms run short of workers and machines, so wages and prices climb.
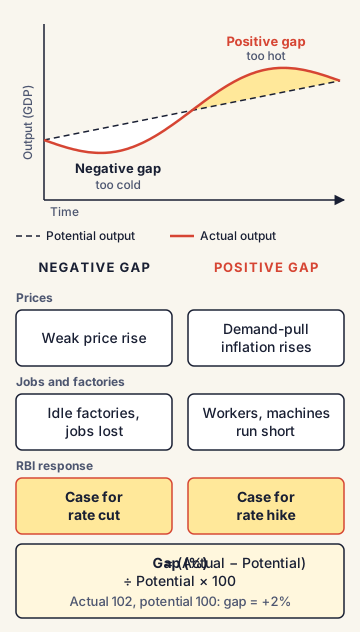
If production stays below potential, people lose jobs and incomes fall. The output gap tells policymakers which of these two problems is bigger right now. This helps the RBI decide whether to raise or cut interest rates.
Where did the idea come from?
- 1962: The American economist Arthur Okun wrote a paper called "Potential GNP: Its Measurement and Significance". He defined the gap between potential and actual output and showed how it moves with unemployment. This link is now called Okun's law: when output falls below potential, unemployment rises.
- In Okun's time, the US Council of Economic Advisers treated about 4% unemployment as the level consistent with potential output.
- 1958: Earlier, A.W. Phillips had shown, using UK data from 1861 to 1957, that low unemployment went together with faster wage rise. This is the Phillips curve. Together, these ideas explain why a positive output gap tends to raise inflation.
- 1993: The economist John Taylor proposed a simple rule for central banks, now called the Taylor rule. It says the policy interest rate should rise when inflation is above target and when the output gap is positive. This made the output gap a standard input in rate-setting around the world.
How is it calculated?
The formula is simple:
Output gap (%) = (Actual GDP minus Potential GDP) divided by Potential GDP, multiplied by 100
Example: suppose potential GDP is ₹100 lakh crore and actual GDP is ₹102 lakh crore. The gap is +2%. The economy is producing 2% more than its comfortable capacity. If actual GDP were ₹98 lakh crore, the gap would be minus 2%.
The hard part: potential output cannot be seen
Actual GDP is measured by the NSO. But potential GDP is an estimate. Nobody can directly observe "what the economy could produce". Economists use three main methods:
- Statistical filters: They separate GDP into a smooth long-term trend and short-term ups and downs. The trend is treated as potential. The most famous is the Hodrick-Prescott (HP) filter, published by Robert Hodrick and Edward Prescott in 1997.
- Production function method: They estimate how much the economy could make if its workers, machines (capital) and technology were used at normal levels.
- Model-based methods: They use extra clues such as inflation, unemployment and credit growth. If inflation is rising fast, it suggests the gap is positive even if GDP looks normal. Central banks use such multivariate models, often with a tool called the Kalman filter.
How does the RBI use it?
The RBI forecasts inflation with a model called the Quarterly Projection Model (QPM). It was built with help from the International Monetary Fund (IMF) and documented in an RBI working paper in November 2016. It is a "gap model": the output gap is one of the key drivers of inflation in it. An upgraded version, QPM 2.0, was described in an RBI Bulletin article in 2023.
In the RBI's thinking, a closing or positive output gap means demand is strong enough to push up prices on its own, apart from any food or oil shock.
India's position and Indian examples
- A 2016 RBI working paper estimated India's potential growth at about 6.8% and found that the output gap had been negative since around late 2012.
- After the COVID-19 shock in 2020-21, actual output fell far below potential, creating a large negative gap. The RBI kept rates low to help the economy recover.
- An RBI Bulletin study in July 2024 said India's potential growth had become stronger after the pandemic recovery.
- The RBI's Annual Report for 2025-26 lists better estimation of potential output as a goal of its Monetary Policy Department for 2026-27.
- As of October 2026, the RBI projected real GDP growth of 7.1% for 2026-27. If potential growth is lower than that for some time, the negative gap closes and can turn positive.
Commonly confused concepts
- Output gap vs GDP growth rate: Growth tells you how fast output is rising. The gap tells you whether the level of output is above or below capacity. An economy can grow at 7% and still have a negative gap if potential growth is also high and it started far below.
- Potential output vs maximum output: Potential is the level that can be kept up without rising inflation, not the absolute maximum. Factories can work overtime for a while, but that pushes the gap positive.
- Positive gap vs negative gap: Positive = demand above capacity, inflation pressure, case for rate hikes. Negative = spare capacity, weak prices and jobs, case for rate cuts.
- Demand-side vs supply-side inflation: A positive output gap causes demand-pull inflation. A bad monsoon or costly crude oil causes cost-push inflation even when the gap is negative.
- Output gap vs inflation gap: The inflation gap is actual inflation minus the target (for India, minus 4%). The Taylor rule uses both gaps.
Issues, criticism and the way forward
- It is invisible and often revised: Because potential output is estimated, different methods give different answers. Estimates can change sharply when new GDP data arrive. A policy based on a wrong gap can be too tight or too loose.
- The end-point problem: Filters like the HP filter are least reliable at the most recent quarters, which is exactly when policymakers need them most.
- Supply shocks move potential itself: A pandemic, war or climate shock can lower potential output. Then a gap that looked negative may actually be closed.
- India-specific challenges: A large informal sector and frequent revisions of GDP data make potential output harder to estimate in India than in many developed countries.
- Way forward: Experts suggest using several methods together, checking them against signals such as core inflation, capacity use in factories and wage growth, and clearly explaining the uncertainty to the public.
Concepts to Know
- GDP (Gross Domestic Product): The total value of all final goods and services produced in a country in a year. "Real" GDP removes the effect of price rise.
- Potential output: The level of output an economy can produce with its normal use of workers, machines and technology, without causing inflation to speed up.
- Demand-pull inflation: Price rise caused when people and businesses want to buy more than the economy can produce.
- Capacity utilisation: How much of a factory's possible production is actually being used. If a factory can make 100 units but makes 75, its capacity utilisation is 75%.
- Filter (in statistics): A mathematical method that separates a smooth long-term trend in data from short-term ups and downs.
- Output gap = (Actual GDP minus Potential GDP) / Potential GDP × 100
- Positive gap: economy above capacity, inflation pressure; negative gap: spare capacity
- Arthur Okun, 1962: "Potential GNP: Its Measurement and Significance"; origin of Okun's law
- Phillips curve: A.W. Phillips, 1958, UK data 1861 to 1957
- Taylor rule: John Taylor, 1993; policy rate responds to both inflation gap and output gap
- Hodrick-Prescott filter: Hodrick and Prescott, published 1997
- RBI Quarterly Projection Model (QPM): RBI working paper, November 2016 (with IMF); QPM 2.0 described in 2023
- RBI October 2026 projection: real GDP growth 7.1% for 2026-27
● Tracked since October 21, 2026 · last seen October 21, 2026 · updates as the daily brief publishes