National Health Accounts (NHA)
How India Tracks Its Health Spending
Updated 16 Nov 2026: Added the full 2023-24 NHA numbers: total spending ₹9.52 lakh crore (3.29% of GDP), government share 43.5%, and the 68:32 State-Centre split.
National Health Accounts, or NHA, is a system that tells us how much money a country spends on health, who pays it, and what it is spent on. It is like a family's yearly account book, but for the health of the whole nation. It adds up money from the government, from families, from employers, from insurance companies and from foreign donors.
In India, the NHA estimates are prepared by the National Health Systems Resource Centre (NHSRC) under the Union Ministry of Health and Family Welfare.
Why does it exist?
A government cannot fix what it cannot measure. Without NHA, nobody would know whether patients or the government carry most of the cost of treatment. It also would not be clear whether money goes to village health centres or to big city hospitals, or whether medicines eat up most of a family's health budget. NHA answers these questions with numbers. These numbers help the government plan budgets, check whether schemes are working, and compare India with other countries.
Where did it come from?
India's Health Ministry began work on National Health Accounts in the early 2000s. The first full estimate covered the year 2004-05. After that there was a long gap of about ten years. In 2014, the Health Ministry named the NHSRC as the National Health Accounts Technical Secretariat (NHATS), the team that does this work permanently.
The NHA estimates for 2013-14, using a new international method, were published in 2017. Since then India has a continuous yearly series starting from 2013-14. The 2022-23 estimates were the 10th round (released in May 2026), and the 2023-24 estimates are the 11th round (released in November 2026).
What method does it use?
India follows the System of Health Accounts 2011 (SHA 2011). This is a common method used across the world, developed by the World Health Organization (WHO), the OECD and Eurostat (the statistics office of the European Union). Because everyone uses the same rules, India's numbers can be fairly compared with other countries. India also has its own National Health Accounts Guidelines for India, 2016, which adapt SHA 2011 to Indian conditions. SHA 2011 looks at every rupee from three angles:
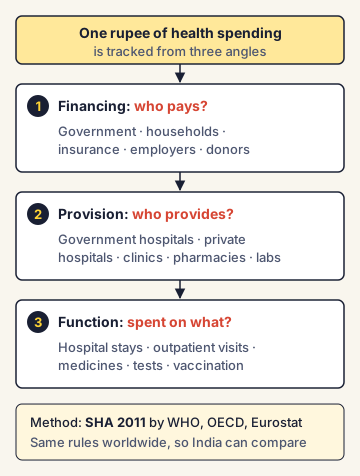
- Financing (who pays?): the government, households, insurance, employers, or donors.
- Provision (who provides the service?): government hospitals, private hospitals, clinics, pharmacies, labs.
- Function (what is it spent on?): hospital stays, outpatient visits, medicines, tests, preventive care like vaccination.
The key measures you must know
- Total Health Expenditure (THE): all money spent on health in the country in a year, by everyone. It includes both day-to-day spending and spending on building assets.
- Current Health Expenditure (CHE): the day-to-day part of THE (salaries, medicines, treatment). It leaves out capital expenditure, which is money for long-lasting assets like hospital buildings and big machines.
- Government Health Expenditure (GHE): money spent on health by the Union government, state governments and local bodies.
- Out-of-Pocket Expenditure (OOPE): money a family pays directly at the moment of treatment, from its own pocket. Insurance premiums are not counted as OOPE.
- Social Security Expenditure on Health: government-funded health insurance (like PM-JAY and state schemes), social health insurance for workers, and medical reimbursement for government employees.
- Private Health Insurance Expenditure: money that flows through private insurance policies.
- Each of these is usually shown in three ways: in rupees, as a share of THE, and as a share of GDP (the total value of goods and services the country produces). Per person (per capita) figures are also given.
How has India's picture changed?
In 2013-14, total health expenditure was about ₹4.53 lakh crore, of which the government paid only about ₹1.30 lakh crore. Families paid 64.2% of all health spending from their own pockets. Over the next decade, the share of the government rose and the share of families fell:
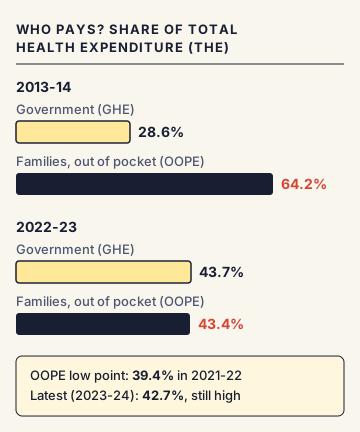
- GHE as a share of THE rose from 28.6% (2013-14) to 43.7% (2022-23), and was 43.5% in 2023-24.
- GHE as a share of GDP rose from 1.15% (2013-14) to 1.43% (2022-23); on the new GDP series with base year 2022-23 it is 1.48%. In 2023-24 it was also 1.43%.
- OOPE as a share of THE fell from 64.2% (2013-14) to 39.4% (2021-22), then rose to 43.4% (2022-23) as government spending eased after the COVID-19 years, and fell again to 42.7% (2023-24).
- In rupees, GHE reached about ₹3.85 lakh crore in 2022-23 and ₹4.14 lakh crore in 2023-24. Per person, GHE rose from about ₹1,042 (2013-14) to ₹2,959 (2023-24).
The 2023-24 picture in numbers
In 2023-24, India's total health expenditure was about ₹9.52 lakh crore. That is 3.29% of GDP, or about ₹6,801 per person. About 87.9% of it was current (day-to-day) spending and 12.1% was capital spending on buildings and equipment. Within government spending, states paid about 68% and the Centre about 32%. This is because health is mainly a State subject, which means the Constitution gives states the main job of running hospitals and public health.
India's targets
The National Health Policy, 2017 set a goal to raise government health spending to 2.5% of GDP by 2025, with about 40% of it from the Centre. It also asked states to spend more than 8% of their budgets on health (by 2020). As of the 2023-24 NHA estimates, government spending was 1.43% of GDP, still well below 2.5%. As of 2025-26, states spent about 6.2% of their budgets on health on average.
Commonly confused concepts
- NHA vs Union Health Budget: The Union Budget shows only what the Central government plans to spend. NHA counts actual spending by everyone: Centre, states, local bodies, families, insurers, employers and donors.
- NHA vs National Family Health Survey (NFHS): NFHS measures health outcomes and behaviour (child nutrition, vaccination, fertility). NHA measures money. One tells you how healthy people are; the other tells you who paid for their care.
- NHA vs NSS health surveys: The National Sample Survey (NSS) rounds on health ask households directly about their illness and spending. NHA uses such surveys as one input, along with government accounts and insurance data, to build the national total.
- THE vs CHE: THE includes capital spending (buildings, equipment); CHE does not.
- OOPE vs total household spending on health: Insurance premiums paid by families are household spending but are not OOPE.
- Organisation names: The National Health Systems Resource Centre (NHSRC) prepares the NHA. The National Health Authority (also written NHA) runs PM-JAY. Same short form, different bodies.
Issues, criticism and the way forward
- Time lag: Estimates come out years after the year they describe, so policy often reacts to old data.
- Data gaps: Household spending is estimated from surveys that are not done every year, and spending by private hospitals and some state bodies is hard to capture fully. So estimates are revised over time.
- Still high OOPE: Even at 42.7%, families pay a large share. The WHO considers high OOPE a key cause of families falling into poverty because of illness.
- Low public spending: Government spending remains far below the 2.5%-of-GDP goal of the National Health Policy, 2017.
- Way forward: Experts suggest faster and state-level NHA estimates, regular household health surveys, higher public spending (especially on primary care, which is cheapest and reaches the most people), and better data from private providers.
Concepts to Know
- Lakh crore: One lakh crore rupees is ₹1,00,000 crore, or one trillion rupees.
- GDP (Gross Domestic Product): The total value of all final goods and services produced in a country in a year. Health spending "as a share of GDP" shows how much of the country's total income goes to health.
- Per capita: Per person. If ₹100 is spent on a family of five, the per capita spending is ₹20.
- Primary healthcare: The first level of care close to home, like a sub-centre or primary health centre, which treats common illness, gives vaccines and checks pregnant women.
- OECD (Organisation for Economic Co-operation and Development): A group of mostly rich countries that works on economic and social statistics and policy. India is not a member.
- Prepared by NHSRC, designated as the National Health Accounts Technical Secretariat (NHATS) in 2014, under the Ministry of Health and Family Welfare
- Method: System of Health Accounts 2011 (SHA 2011), plus National Health Accounts Guidelines for India, 2016
- First Indian estimate: 2004-05; continuous series from 2013-14
- 2013-14: THE about ₹4.53 lakh crore; GHE about ₹1.30 lakh crore; OOPE 64.2% of THE
- 2022-23 (10th round): GHE ₹3.85 lakh crore; GHE 43.7% of THE; GHE 1.43% of GDP (1.48% on new GDP series); OOPE 43.4%
- 2023-24 (11th round): THE ₹9.52 lakh crore (3.29% of GDP, ₹6,801 per capita); GHE ₹4.14 lakh crore (43.5% of THE, 1.43% of GDP); per capita GHE ₹2,959; OOPE 42.7%; social security share 11%; private insurance share 10.2%
- 2023-24 government health spending: states about 68%, Centre about 32%
- National Health Policy, 2017: public health spending 2.5% of GDP by 2025; states to spend more than 8% of their budgets on health
- 16 Nov 2026Added the full 2023-24 NHA numbers: total spending ₹9.52 lakh crore (3.29% of GDP), government share 43.5%, and the 68:32 State-Centre split.
● Tracked since May 27, 2026 · last seen November 16, 2026 · updates as the daily brief publishes