Global Innovation Index (GII)
How Countries Are Ranked on Innovation
The Global Innovation Index, or GII, is a yearly ranking of how innovative the world's economies are. It is published by the World Intellectual Property Organization (WIPO), a United Nations agency based in Geneva. It gives each country a score out of 100 using around 80 indicators, from school enrolment and research spending to patents, high-tech exports and creative goods. In the 2026 edition, it ranked 139 economies, and India stood 38th.
Why does it exist?
Earlier, people judged innovation mainly by two numbers: how much a country spends on research, and how many patents it files. But innovation is wider than that. A country also needs good institutions, skilled people, roads and internet, easy access to loans and investment, and businesses that turn ideas into products. The GII was built to capture this whole picture in one score.
It helps governments see where they are strong and where they are falling behind, much like a school report card shows marks subject by subject, not just the total.
Where did it come from?
- The GII was started in 2007 by Professor Soumitra Dutta at INSEAD, a business school, together with World Business, a British magazine.
- WIPO joined the project in 2011, and Cornell University joined in 2013. For several years the three published it together.
- Today WIPO leads the publication, working with partner institutions. Each year's report also has a special theme. The 2026 report is titled "Powering Entrepreneurs at the Frontier of Science".
How is the GII built?
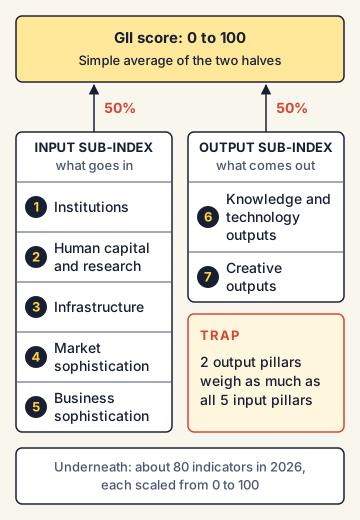
The index has two halves, called sub-indices.
- Innovation Input Sub-Index: the things a country puts in to make innovation possible. It has five pillars:
- Institutions (rule of law, government effectiveness, business environment)
- Human capital and research (education, researchers, R&D spending)
- Infrastructure (ICT, energy, general infrastructure, ecological sustainability)
- Market sophistication (credit, investment, trade and market size)
- Business sophistication (knowledge workers, links between industry and universities, absorbing foreign knowledge)
- Innovation Output Sub-Index: what a country actually gets out. It has two pillars:
- Knowledge and technology outputs (patents, scientific papers, high-tech production and exports)
- Creative outputs (trademarks, industrial designs, creative goods and services, online creativity)
How is the score calculated?
Each indicator is scaled from 0 to 100. Indicators are averaged (with weights) into pillar scores, and pillars are averaged into the two sub-index scores. The final GII score is the simple average of the input and output sub-index scores. So inputs and outputs carry equal weight. The number of indicators changes a little from year to year: it was 78 in 2025 and around 80 in 2026.
What does the input-output split tell us?
Comparing the two halves shows how well a country turns effort into results. If output rank is better than input rank, the country is getting more results than its resources would suggest: it is "efficient". If the input rank is better, the country invests but does not yet convert this into enough results.
Who leads the ranking?
In the 2026 edition the top five were Switzerland, Sweden, the United States, South Korea and Singapore. Switzerland has topped the GII for well over a decade.
India's position
- India's rank improved from 81st in 2015 to 39th in 2024, 38th in 2025 and 38th in 2026 (score 40.1).
- In 2026 India ranked 49th on inputs but 25th on outputs, so it produces more innovation output than its inputs would suggest.
- India is the top-ranked economy in the lower-middle-income group.
- India's strengths include ICT services exports, late-stage venture capital and knowledge outputs. Bengaluru, Delhi, Mumbai and Chennai appear among the world's leading science and technology clusters (places where patents, papers and venture capital deals concentrate).
- Weaker areas include institutions, infrastructure and skills, and low overall research spending (about 0.64% of GDP).
India's own version: the India Innovation Index
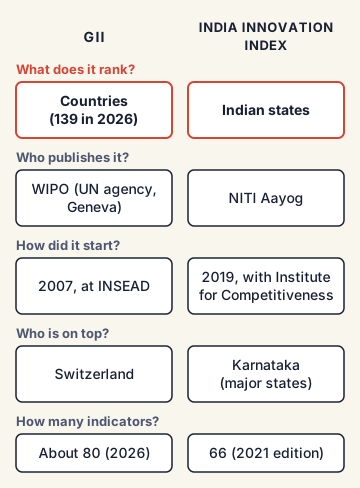
NITI Aayog, with the Institute for Competitiveness as knowledge partner, built an India Innovation Index modelled on the GII to rank states. Editions came out in October 2019, January 2021 and July 2022 (the 2021 index). Karnataka topped the major states in all three. The 2021 edition used 66 indicators, up from 36 in the earlier edition.
Commonly confused concepts
- GII vs India Innovation Index: The GII ranks countries and is published by WIPO. The India Innovation Index ranks Indian states and is published by NITI Aayog.
- GII vs the India S&T Scoreboard: The scoreboard is a data platform that lets users explore and compare state data. It is not a single ranking with one score.
- GII vs GERD: GERD (Gross Expenditure on R&D) is one input number: how much money is spent on research. The GII combines dozens of inputs and outputs.
- WIPO vs WTO: WIPO is a UN agency for intellectual property (patents, trademarks, copyright). The World Trade Organization (WTO) deals with trade rules; it handles intellectual property through the TRIPS Agreement, but it does not publish the GII.
- Ranks across years: The list of countries and indicators changes each year, so small rank changes are not always a real improvement or decline.
Issues, criticism and the way forward
- What counts as innovation? Some scholars argue the GII gives weight to factors that are not central to innovation, such as ease of paying taxes or electricity output.
- Too broad pillars: A 2024 study argued that the pillars mix many indicators together, which hides the real drivers of innovation, and suggested redesigning the model.
- Data gaps: Many indicators depend on data that poorer countries collect irregularly, which can affect their scores.
- India's challenge: India's rank has risen fast, but its input side is weaker. Experts point to raising research spending, especially from private industry, deepening industry-university links, and spreading innovation beyond a few big-city clusters to more states.
Concepts to Know
- Indicator: One measurable number used in an index, like the number of patents per person.
- Pillar: A group of related indicators that measure one area, such as "Infrastructure".
- Sub-index: A larger group of pillars. The GII has two: input and output.
- Patent: A legal right given to an inventor, usually for 20 years, that stops others from copying the invention without permission.
- Venture capital: Money invested in young, fast-growing companies (startups) in return for a share in them.
- Intellectual property: Legal ownership of creations of the mind, such as inventions, brand names, designs and books.
- Publisher: WIPO (UN agency, Geneva); started 2007 at INSEAD by Soumitra Dutta
- Structure: 7 pillars (5 input, 2 output); about 80 indicators in 2026 (78 in 2025)
- GII score = simple average of input and output sub-index scores
- 2026 edition: 139 economies; top 5: Switzerland, Sweden, USA, South Korea, Singapore
- India: 81st (2015) → 39th (2024) → 38th (2025) → 38th (2026, score 40.1)
- India 2026: 49th in inputs, 25th in outputs; top lower-middle-income economy
- Indian clusters: Bengaluru, Delhi, Mumbai, Chennai
- India Innovation Index (NITI Aayog + Institute for Competitiveness): 2019, 2020, 2021 editions; Karnataka first each time
● Tracked since November 03, 2026 · last seen November 03, 2026 · updates as the daily brief publishes