Regional Disparities in India
Balanced Regional Development
Regional disparity means that some parts of a country are much richer and more developed than others. In India, states like Goa, Tamil Nadu, Karnataka and Gujarat have high incomes, while states like Bihar, Uttar Pradesh and Jharkhand have much lower incomes and more poor people. Balanced regional development is the goal of narrowing this gap, so that where a person is born does not decide how well they can live. It is one of the oldest and biggest challenges of Indian planning.
Why does it matter?
Think of a family where one child gets good food, good school and a good job, while another child gets very little. The family as a whole may look "fine" on average, but one child is left behind. A country is the same. If growth happens only in a few places:
- People from poorer states must migrate long distances for work, often into low-paid, insecure jobs.
- Poverty, hunger and poor health stay stuck in the left-behind regions.
- Feelings of neglect can create social and political tension between regions.
- The whole country grows more slowly, because the talent and labour of many crore people are not fully used.
How big is the gap?
The gap shows up in income, health and human development:
- Income: In 2023-24, Bihar had the lowest per capita net state domestic product (average income per person) among states, about ₹32,227 at constant prices. Uttar Pradesh (about ₹50,341) and Jharkhand (about ₹65,062) came next from the bottom. Goa had the highest.
- Fertility: In the National Family Health Survey-5 (2019-21), India's total fertility rate (average children per woman) was 2.0. Bihar was at about 3.0 and Uttar Pradesh at about 2.4, above the "replacement level" of 2.1.
- Poverty: The World Bank's October 2026 brief found that about 57% of India's poor live in the belt from Uttar Pradesh to West Bengal. NITI Aayog's multidimensional poverty data also shows the highest shares of poor people in states such as Bihar, Jharkhand and Uttar Pradesh.
Why do some regions fall behind?
There is no single cause. Economists usually point to a mix of history, geography and policy:
- History: Under British rule, the Permanent Settlement (1793) in Bengal, Bihar and Odisha created powerful landlords (zamindars) who collected rent but rarely invested in farming. Studies have linked this to weaker agriculture and public services in these areas even after independence.
- Geography: Hilly, remote or flood-prone areas (like north Bihar, hit by floods from the Kosi river) find it harder and costlier to build roads, factories and markets.
- Policy: The Freight Equalisation Policy (1952) made minerals like coal and iron ore cost the same everywhere in India. This took away the natural advantage of mineral-rich eastern states (today's Jharkhand, Odisha, West Bengal), because factories could be set up far away at no extra cost. The policy ended in 1993, but by then industry had already settled in the west and south.
- Cumulative causation: The Swedish economist Gunnar Myrdal (1957) explained that once a region pulls ahead, it keeps pulling ahead. Capital, skilled workers and businesses move to rich areas (backwash effects). Some benefits also spread back to poor areas (spread effects), but Myrdal argued backwash usually wins unless the government steps in.
Where did the idea of BIMARU come from?
In the mid-1980s, the demographer Ashish Bose made the acronym BIMARU from the first letters of Bihar, Madhya Pradesh, Rajasthan and Uttar Pradesh. It sounds like the Hindi word bimar, meaning "sick". He used it to show that these states were lagging on population control, health and income. After 2000, Jharkhand, Chhattisgarh and Uttarakhand were carved out of Bihar, Madhya Pradesh and Uttar Pradesh.
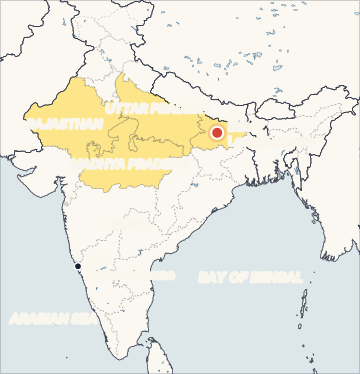
Some of these states, especially Madhya Pradesh and Rajasthan, have grown fast since, so many experts say the label is now outdated.
What does the Constitution say?
Balanced development is part of the Directive Principles of State Policy (Part IV, guidelines for the government that courts cannot enforce):
- Article 38(2), added by the 44th Amendment Act, 1978, tells the State to minimise inequalities in income and to try to remove inequalities in status, facilities and opportunities, not only among individuals but also among groups of people living in different areas. This is the clearest constitutional basis for reducing regional gaps.
- Article 371 and Articles 371A to 371J give special provisions to certain states and regions. For example, Article 371(2) allows separate development boards for Vidarbha, Marathwada and the rest of Maharashtra, and for Saurashtra, Kutch and the rest of Gujarat.
- Article 275(1) lets Parliament give grants-in-aid to states in need, including special grants for welfare of Scheduled Tribes and raising the level of administration in Scheduled Areas.
How does the government try to close the gap?
India uses money transfers, special programmes and targeted schemes:
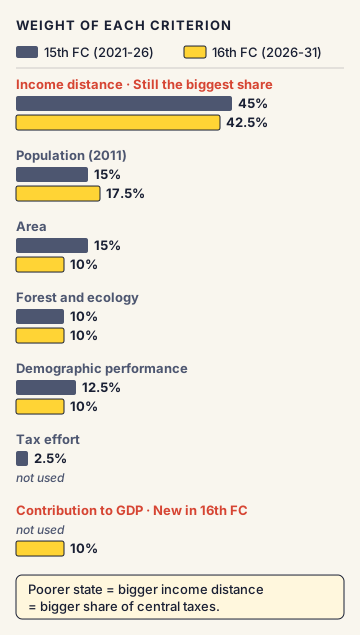
- Finance Commission (Article 280): Every five years, it decides how central taxes are shared among states. It gives poorer states a bigger share through the "income distance" criterion: the further a state's per capita income is below the richest state, the more it gets.
- 15th Finance Commission (2021-26): states' share 41%; income distance 45%, population (2011) 15%, area 15%, forest and ecology 10%, demographic performance 12.5%, tax effort 2.5%.
- 16th Finance Commission (2026-31, chaired by Arvind Panagariya; report tabled 1 February 2026): states' share kept at 41%; income distance 42.5%, population (2011) 17.5%, demographic performance 10%, area 10%, forest 10%, and a new criterion, contribution to GDP, 10%.
- Gadgil Formula (1969): used to share central plan assistance among states, with a special preference for hill and border states. This is how Special Category Status began, first for Jammu and Kashmir, Assam and Nagaland. After the 14th Finance Commission (2015) raised states' tax share from 32% to 42%, the Centre said the general-versus-special distinction had largely ended for new states.
- Backward Regions Grant Fund (BRGF, 2006-07): gave untied money to backward districts through panchayats, run by the Ministry of Panchayati Raj. It was delinked from central support from 2015-16, after the 14th Finance Commission increased untied tax devolution.
- Aspirational Districts Programme (January 2018): run by NITI Aayog for 112 of the most backward districts. It ranks districts on 49 key performance indicators under five themes: health and nutrition, education, agriculture and water resources, financial inclusion and skill development, and basic infrastructure. Districts compete on their improvement, not their starting level ("competitive federalism").
- Aspirational Blocks Programme (7 January 2023): the same model taken down to 500 backward blocks (sub-district units).
- Purvodaya (Union Budget 2024-25): a plan for the all-round development of the eastern region, covering Bihar, Jharkhand, West Bengal, Odisha and Andhra Pradesh, focused on human resources, infrastructure and economic opportunities.
The Raghuram Rajan Committee (2013)
The government asked a committee led by Raghuram Rajan to build a fair method for identifying backward states. It made a Composite Development Index built as an average of 10 parts, such as per capita consumption, poverty rate, education, health, female literacy, household amenities, urbanisation and connectivity. States scoring 0.6 or more were called least developed: Odisha (most backward), Bihar, Madhya Pradesh, Chhattisgarh, Jharkhand, Arunachal Pradesh, Assam, Meghalaya, Uttar Pradesh and Rajasthan. Goa was found most developed. The government did not formally adopt the index for fund sharing.
Commonly confused concepts
- Special Category Status vs Special Status (Article 370): Special Category Status was a financial arrangement (more central help for hill, border and backward states), not mentioned in the Constitution. Special Status under Article 370 was a constitutional grant of autonomy to Jammu and Kashmir, ended in 2019.
- Aspirational Districts vs BRGF: BRGF mainly gave extra money. The Aspirational Districts Programme gives no big new fund; it improves results by joining up existing schemes, tracking data monthly and making districts compete.
- Income distance vs per capita income: Per capita income is a state's average income per person. Income distance is the gap between a state's per capita income and the highest one; a bigger gap brings a bigger tax share.
- Regional disparity vs inequality: Inequality is about the gap between rich and poor people. Regional disparity is about the gap between rich and poor places. A rich state can still have high inequality inside it.
Issues, criticism and the way forward
- Equity vs efficiency: Richer, often southern and western, states argue that they collect more taxes but get back less, and that they are "punished" for controlling population. Poorer states argue that they need more help to catch up. The 16th Finance Commission tried to balance both by adding contribution to GDP while keeping income distance as the biggest criterion.
- Weak state capacity: Money alone does not close gaps. Poorer states often have fewer teachers, doctors and officials per person, and struggle to spend funds well.
- Jobs and wages: Poor states have a large share of people in low-productivity farming. Without factories and services creating jobs, workers keep migrating out.
- Data and measurement: Different poverty lines and survey methods can change the picture, so comparisons over time need care.
- Way forward suggested by experts: invest in human capital (school learning, nutrition, health) in lagging states; build roads, power and industrial corridors there; strengthen local governments; reward improvement through outcome-based programmes like Aspirational Districts; and encourage labour-intensive manufacturing in the eastern belt.
Concepts to Know
- Per capita net state domestic product (NSDP): The total income produced in a state in a year, after removing wear and tear of machines, divided by the number of people. A simple way to compare how rich the average person in each state is.
- Constant prices: Figures adjusted to remove the effect of price rise, so that a real increase in income can be seen.
- Total fertility rate (TFR): The average number of children a woman is expected to have in her lifetime. A TFR of 2.1 is the "replacement level", where the population stays roughly stable over time.
- Divisible pool: The part of the Centre's tax collection that is shared with states. It leaves out cesses and surcharges.
- Grant-in-aid: Money the Centre gives a state for a purpose, which does not need to be repaid.
- Competitive federalism: Making states (or districts) compete with each other on results, so that good performance is rewarded.
- Article 38(2) (inserted by the 44th Amendment, 1978): State must minimise inequalities in income and among groups in different areas
- Article 280: Finance Commission; Article 275(1): grants-in-aid to states; Articles 371 to 371J: special provisions for states
- BIMARU: coined by Ashish Bose, mid-1980s (Bihar, MP, Rajasthan, UP)
- 15th FC (2021-26): states' share 41%; income distance 45%
- 16th FC (2026-31): states' share 41%; income distance 42.5%; new criterion contribution to GDP 10%; chair Arvind Panagariya
- Gadgil Formula: 1969; 14th FC (2015) raised states' share from 32% to 42%
- Raghuram Rajan Committee (2013): Composite Development Index; 10 least developed states, Odisha most backward
- Aspirational Districts Programme: January 2018, 112 districts, 49 indicators, NITI Aayog
- Aspirational Blocks Programme: 7 January 2023, 500 blocks
- Purvodaya: Budget 2024-25; Bihar, Jharkhand, West Bengal, Odisha, Andhra Pradesh
- Lowest per capita NSDP (2023-24, constant prices): Bihar, about ₹32,227
● Tracked since November 10, 2026 · last seen November 10, 2026 · updates as the daily brief publishes