Living Planet Report and Living Planet Index
The Living Planet Report (LPR) is a report published by WWF every two years on the health of the world's wildlife and nature. Its headline number comes from the Living Planet Index (LPI), which tracks how the sizes of thousands of animal populations have changed since 1970. You can think of the LPI as a "stock market index" for wildlife: instead of tracking share prices, it tracks whether animal populations are growing or shrinking. A falling LPI means, on average, wildlife populations are getting smaller.
Why does it exist?
Nature is huge and varied. Governments and citizens cannot easily tell whether wildlife as a whole is doing better or worse. Scientists needed one simple measure that shows the overall trend over decades, like a health check-up for the planet. The LPI gives that single number. It helps people see the scale of the problem and helps countries check whether global biodiversity targets are being met.
Where did it come from?
- 1997: WWF created the Living Planet Index, working with the World Conservation Monitoring Centre (now UNEP-WCMC).
- 1998: The first Living Planet Report was published using the LPI.
- 2006 onwards: The Zoological Society of London (ZSL) manages the index, in partnership with WWF.
- The report now comes out every two years (biennial). Earlier editions also carried the Ecological Footprint, a measure of how much nature human activity uses up.
How does the index work?
It is built step by step:
- Scientists collect long-term counts of animal populations (a group of one species living in one place, such as the tigers of one reserve). Data come from research papers, government reports and online databases.
- Only vertebrates (animals with a backbone: mammals, birds, reptiles, amphibians and fish) are included, because they have the best long-term records.
- For each population, scientists work out how much it grew or shrank, year by year, compared with 1970, which is set as the starting value (baseline).
- These changes are averaged, first within species, then within groups, then by region and ecosystem (land, freshwater and sea). The method uses a weighted geometric mean, a type of average based on percentage changes rather than raw numbers.
- The final number shows the average percentage change in population size since 1970.
What does "a 73% decline" really mean?
This is the most misunderstood part. It does not mean that 73% of all animals have died. It also does not mean 73% of species or populations have disappeared. It means that, on average, the monitored populations are about 73% smaller than they were in 1970. A simple example: if one population fell from 100 to 10 animals (a 90% fall) and another fell from 100 to 50 (a 50% fall), the average change is a large decline, even though no population vanished.
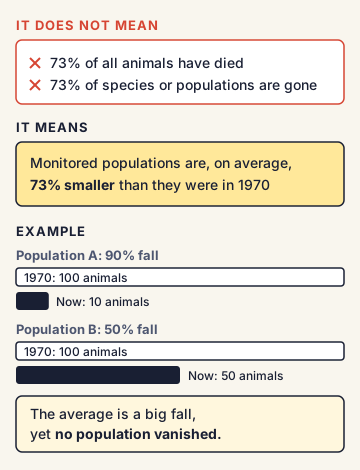
Because declines are very large and increases smaller, the average goes down even when half the populations are stable or growing.
Key findings of recent editions
- LPR 2024: 73% average decline, 1970 to 2020; about 34,800 populations of about 5,500 species. Freshwater 85%, terrestrial 69%, marine 56%. Latin America and the Caribbean 95%, Africa 76%, Asia-Pacific 60%.
- LPR 2026: 73% average decline, 1970 to 2022; 35,803 populations of 5,790 species. Freshwater 85%, terrestrial 69%, marine 59%. Latin America and the Caribbean 95%, Africa 80%, Asia-Pacific 49%, North America 28%, Europe and Central Asia 23%.
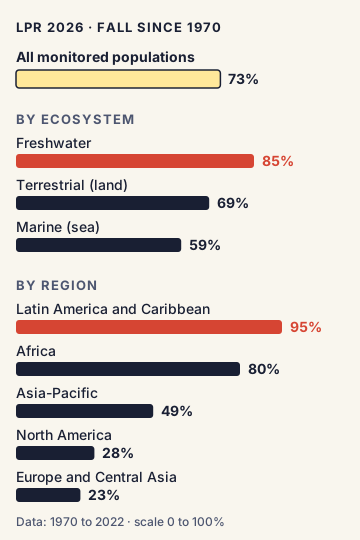
Editions cannot be compared directly. Each new edition adds more populations and species (967 populations and 295 species were added after 2024) and covers a longer period.
Why are tropical regions and fresh water hit hardest?
Tropical regions like Latin America were rich in wildlife and have seen fast forest clearing for farming and ranching since 1970. Regions like Europe had already lost much wildlife before 1970, so their decline after 1970 looks smaller. Fresh water (rivers, lakes, wetlands) is hit by dams, pollution, sand mining and water extraction all at once.
What drives the decline?
In order of how often they are reported:
- Habitat loss and degradation (mainly caused by how we grow food)
- Overexploitation (hunting, poaching, over-fishing)
- Climate change
- Pollution
- Invasive species
- Disease
The report links these to wider failures in the world's food, energy and finance systems.
India's position
The LPR does not give a separate index for each country. But it highlights India as an example of recovery: tigers (Project Tiger, 1973), one-horned rhinos (Kaziranga and other parks in Assam), Ganga river dolphins (India's National Aquatic Animal), Asiatic lions, common leopards and snow leopards. At the same time, WWF-India notes worrying trends in birds, amphibians, bats (about 135 species, poorly studied) and freshwater fish.
Commonly confused concepts
- Living Planet Index vs IUCN Red List: The LPI measures how the size of populations has changed on average. The Red List measures each species' risk of extinction and gives it a category (Vulnerable, Endangered and so on). A species can have falling populations and still not be "threatened" on the Red List.
- Living Planet Report vs Global Biodiversity Outlook vs IPBES Global Assessment: The LPR is a WWF (non-government) report every two years. The Global Biodiversity Outlook is published by the Convention on Biological Diversity (CBD). IPBES (an intergovernmental science body) produced the 2019 Global Assessment, which warned that about 1 million species face extinction.
- Population vs species: A species is a type of animal (the tiger). A population is one group of that species in one place (the tigers of Kanha). The LPI counts populations.
- WWF vs WWF-India: WWF International is based in Gland, Switzerland. WWF-India is its Indian organisation, set up in 1969.
Issues, criticism and the way forward
- Bias in data: Europe and North America have more long-term data than Africa, Asia or the tropics. Some editions were criticised for over-representing such well-studied regions.
- Driven by a few populations: A 2020 study found that the overall decline figure was driven by a small number of populations with extreme falls (under 3% of populations). Other studies have pointed to mathematical issues that may overstate declines.
- Misreading the headline: Media often report it as "we lost 73% of all animals", which is wrong and can cause confusion.
- Supporters' view: WWF and ZSL say the index is still one of the best long-term measures available and is used as an official indicator for global biodiversity targets, including the Kunming-Montreal Global Biodiversity Framework.
- Way forward suggested by the report: protect and restore habitats, change food systems to waste less and farm more sustainably, move money away from harmful activities, and give local and indigenous communities a central role in conservation.
Concepts to Know
- Biodiversity: The variety of all life on Earth: different species, the genes within them, and the ecosystems they form.
- Vertebrates: Animals with a backbone: mammals, birds, reptiles, amphibians and fish.
- Baseline: The starting point used for comparison. For the LPI, 1970 is the baseline set to a value of 1.
- Overexploitation: Taking too many animals or plants from the wild (by hunting, fishing or collecting) faster than they can breed back.
- Invasive species: A plant or animal brought from elsewhere that spreads fast and harms native species, like Lantana in Indian forests.
- Ecological Footprint: A measure of how much land and sea area is needed to produce what people use and absorb their waste.
- LPI created in 1997 by WWF with UNEP-WCMC; first LPR in 1998; ZSL manages the LPI since 2006; report is biennial
- LPI covers only vertebrates; baseline year 1970; uses a weighted geometric mean of population trends
- LPR 2026: 73% average decline (1970 to 2022); 35,803 populations; 5,790 species
- LPR 2026 by ecosystem: freshwater 85%, terrestrial 69%, marine 59%
- LPR 2026 by region: Latin America and Caribbean 95%, Africa 80%, Asia-Pacific 49%, North America 28%, Europe and Central Asia 23%
- LPR 2024: 73% average decline (1970 to 2020)
- Half of monitored populations stable (7%) or increasing (43%)
- Top threat: habitat loss and degradation; then overexploitation, climate change, pollution, invasive species, disease
- LPI is an indicator under the Kunming-Montreal Global Biodiversity Framework
● Tracked since October 07, 2026 · last seen October 07, 2026 · updates as the daily brief publishes