Gross State Domestic Product (GSDP)
Gross State Domestic Product, or GSDP, is the total value of all final goods and services produced inside one state's borders in one year. It is the state-level version of India's GDP. Just as GDP tells us the size of India's economy, GSDP tells us the size of Maharashtra's, Bihar's or Telangana's economy. It is the most common way to compare how rich or how fast-growing different states are.
Why do we need a state-level GDP?
India is a federal country. States run schools, hospitals, police, roads and farming support, and they borrow and spend huge amounts of money. To plan well, a state must know how big its economy is and which sectors are growing. The Centre and the Finance Commission also need it, because many rules on borrowing and money-sharing are written as "a percentage of GSDP". Without a reliable GSDP, these rules would have no fair measuring stick.
Who prepares it?
Each state and UT has a Directorate of Economics and Statistics (DES). The DES compiles its own GSDP. The National Statistics Office (NSO) under MoSPI gives the methods, guidelines and training, so that all states measure in the same way. MoSPI also publishes the state-wise figures together, so they can be compared.
The supra-regional sectors
Some activities do not belong to any one state. Railways, communication (telecom, post), banking and insurance, and central government administration work across the whole country. You cannot easily say "this much of Indian Railways' output was produced in Odisha". So the NSO estimates these supra-regional sectors at the national level and then allocates (shares out) the total among states using suitable indicators, such as staff salaries paid in each state. The states then add these shares to their own estimates.
How is GSDP measured today?
Most states use the production approach. They add up the value added by every sector of the state economy: farming, mining, manufacturing, construction, trade, transport, services and so on. This total is called Gross State Value Added (GSVA) at basic prices. Then:
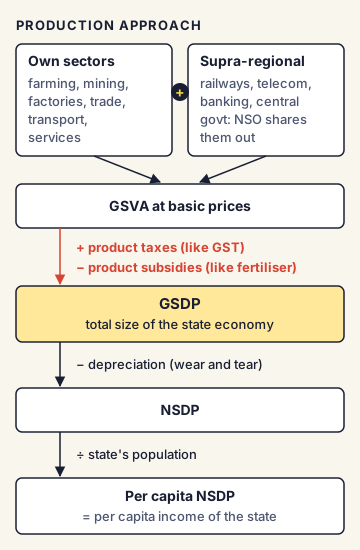
- GSDP = GSVA at basic prices + product taxes − product subsidies
Product taxes are taxes charged per unit of a product, like GST. Product subsidies are the opposite: money the government pays per unit, like a fertiliser subsidy. In May 2026, MoSPI finalised a Uniform Guideline for compiling GSVA with base year 2022-23, after placing a draft for comments on 7 April 2026. States and UTs are required to shift to the new base year.
The missing piece: GSDP by expenditure
National GDP is also measured from the spending side (who bought the output). At the state level, this has been patchy:
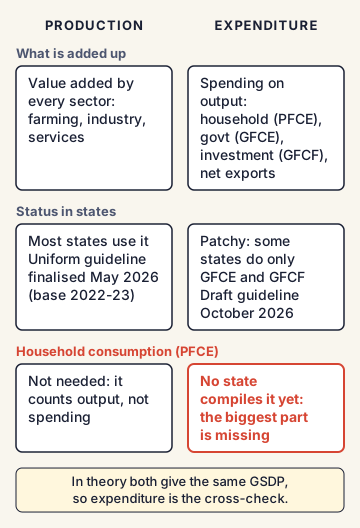
- Some states compile government consumption (GFCE) and investment (GFCF).
- No state compiles household consumption (PFCE), which is the biggest part of any economy.
This is why, in October 2026, the NSO released a draft guideline for compiling GSDP by the expenditure approach with base year 2022-23. It covers PFCE, GFCE, GFCF, change in stocks, valuables and net exports. Where direct state data are missing, it recommends allocation methods: take a reliable national total and split it among states using an indicator that shows each state's share.
A key input for state-wise PFCE is expected to be the Household Consumption Expenditure Survey (HCES), which shows how much an average person spends in each state, combined with population figures.
Related measures you must know
- NSDP (Net State Domestic Product): GSDP minus depreciation (the wear and tear of machines and buildings during the year).
- Per capita income of a state: usually measured as per capita NSDP, that is NSDP divided by the state's population. A small state with a modest GSDP can still have a high per capita income.
- District Domestic Product (DDP): the same idea one level down, for a district. Many states now publish DDP to plan district-wise.
- Current vs constant prices: GSDP at current prices uses this year's prices. GSDP at constant prices uses base-year prices, so it removes the effect of price rise and shows real growth.
How is GSDP used in policy?
- Borrowing limits: States' fiscal deficit (the gap between spending and income, filled by borrowing) is capped as a share of GSDP. The 16th Finance Commission (period 2026-31) recommended a limit of 3% of GSDP for states' annual fiscal deficit.
- Sharing of central taxes: The 16th Finance Commission's formula gives 42.5% weight to "income distance", the gap between a state's per capita GSDP and that of the richest states. Poorer states get more. It also added a new criterion, "contribution to GDP" (10% weight), based on each state's share in national GDP (using the square root of the share to soften extremes).
- Debt ratios: States' debt is judged as debt-to-GSDP. A wrong GSDP figure makes a state look more or less indebted than it really is.
- Planning and investment: Investors, credit rating agencies and the RBI use GSDP growth to compare states.
Commonly confused concepts
- GSDP vs GDP: GSDP is for one state; GDP is for the whole country. Adding all states' GSDP does not exactly equal India's GDP, because states use different data and methods. This mismatch is one reason MoSPI wants uniform guidelines.
- GSDP vs GSVA: GSVA is value added by sectors at basic prices. GSDP adds product taxes and removes product subsidies.
- GSDP vs NSDP: NSDP = GSDP minus depreciation.
- GSDP vs per capita income: GSDP shows total size; per capita NSDP shows the average income per person. Uttar Pradesh has a large GSDP but a low per capita income because of its huge population.
- Production approach vs expenditure approach: Production adds up value made by sectors. Expenditure adds up spending (consumption, investment, government, net exports). In theory both give the same number.
Issues, criticism and the way forward
- Weak state data systems: Many DES offices are short of staff, funds and modern tools. Quality differs widely from state to state.
- Heavy use of allocation: When national totals are split by indicators instead of being measured directly, a state's real situation may be hidden. A state that is growing faster than the indicator suggests will be under-counted.
- No household consumption data: Without state-wise PFCE, nobody can check a state's GSDP from the spending side. Experts have long asked for this cross-check.
- Different timelines: States release estimates at different times and revise them often. This makes comparisons difficult.
- Way forward: Common guidelines from MoSPI, more use of administrative data (like GST returns and vehicle registrations), regular state-level surveys, and better training for DES staff. The draft expenditure-side guideline is a step in this direction.
Concepts to Know
- Final goods and services: Things bought for final use, not for making something else. Bread bought by a family is final; flour bought by a bakery is not. Only final goods are counted, to avoid counting the same value twice.
- Value added: The extra value a producer adds. If a baker buys flour for ₹30 and sells bread for ₹50, the value added is ₹20.
- Base year: The reference year whose prices and structure are used to measure the economy. India's current base year for national accounts is 2022-23 (earlier 2011-12).
- Depreciation: The loss in value of machines, buildings and vehicles because of use and age during the year.
- Fiscal deficit: The amount a government has to borrow in a year because its spending is more than its income (excluding borrowing).
- Allocation indicator: A number used to share a national total among states. For example, if a state has 8% of all bank deposits, it may be given 8% of the national banking sector's value added.
- GSDP is compiled by each state's Directorate of Economics and Statistics (DES); NSO (MoSPI) gives the methodology
- Supra-regional sectors (railways, communication, banking and insurance, central government administration) are estimated nationally by NSO and allocated to states
- GSDP = GSVA at basic prices + product taxes − product subsidies
- Uniform Guideline for GSVA with base year 2022-23: draft placed on 7 April 2026; finalised in May 2026
- Draft guideline for GSDP by expenditure approach (base year 2022-23): comments until 28 October 2026
- No state or UT currently compiles PFCE
- 16th Finance Commission: state fiscal deficit cap of 3% of GSDP; income distance weight 42.5%; new "contribution to GDP" criterion with 10% weight
● Tracked since April 07, 2026 · last seen October 09, 2026 · updates as the daily brief publishes