Fiscal Multiplier
How Government Spending Grows the Economy
The fiscal multiplier tells us how much a country's total output (GDP) rises when the government spends one extra rupee, or how much it falls when the government cuts one rupee of spending or raises one rupee of tax. If the multiplier is 2, then ₹100 of extra government spending finally adds ₹200 to GDP. If it is 0.5, the same ₹100 adds only ₹50. It is the single most useful number for judging whether a type of government spending is "worth it" for growth.
Why does the idea matter?
Every government has limited money and must choose between roads, salaries, subsidies, cash transfers and tax cuts. The multiplier tells it which choice gives the biggest push to the economy per rupee. It also helps answer a big policy question: when the economy is weak, should the government spend more, and on what? And when it wants to cut its deficit, which cuts will hurt growth the least?
Where did the idea come from?
- The idea was first put forward by the British economist Richard Kahn in an article titled "The Relation of Home Investment to Unemployment" in the Economic Journal in June 1931. Kahn's version was an employment multiplier: it showed how jobs created directly by public works lead to more jobs elsewhere.
- John Maynard Keynes built it into his famous book The General Theory of Employment, Interest and Money (1936) as the investment multiplier, which links extra investment to extra national income. Keynes himself credited Kahn with first introducing the idea.
- This became the base of Keynesian economics: the view that in a slump, government spending can lift demand, output and jobs. It shaped policy after the Great Depression of the 1930s.
- Later research, especially after the 2008 global financial crisis, measured multipliers with real data and found that they are not one fixed number. They change with the type of spending, the state of the economy and how open the economy is.
How does the multiplier work, step by step?
Spending by one person is income for another. Here is a simple chain:
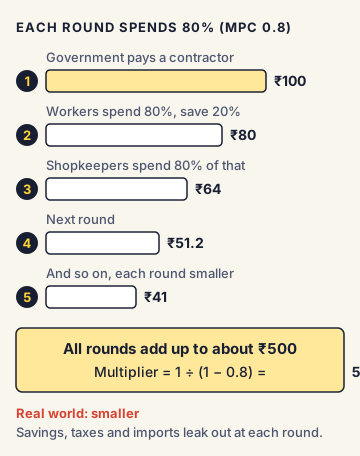
- The government pays a contractor ₹100 to build a road.
- The contractor pays workers and suppliers. Suppose they spend ₹80 of it on food, clothes and rent, and save ₹20.
- The shopkeepers and landlords who received that ₹80 spend 80% of it, which is ₹64.
- The next round adds ₹51.2, then ₹41, and so on, each round smaller than the last.
Add up all the rounds and the first ₹100 becomes about ₹500 of total income. Think of a stone dropped in a pond: the first splash makes ripples that spread far beyond the spot where it fell.
The simple formula
The share of each extra rupee of income that people spend is called the marginal propensity to consume (MPC). The basic multiplier is:
Multiplier = 1 ÷ (1 − MPC)
- If MPC = 0.8, the multiplier is 1 ÷ 0.2 = 5.
- If MPC = 0.9, the multiplier is 1 ÷ 0.1 = 10.
- If MPC = 0.5, the multiplier is 1 ÷ 0.5 = 2.
So the more people spend out of each extra rupee, the bigger the multiplier. This textbook formula gives large numbers. In the real world, the multiplier is much smaller, because money "leaks" out of the chain (explained below).
Why is the real multiplier smaller? The leakages
At each round, some money stops circulating inside the country:
- Savings: money kept aside is not spent in that round.
- Taxes: part of each income goes to the government as tax.
- Imports: if people buy imported phones or oil, the money goes abroad and boosts another country's economy. This is why multipliers are usually smaller in open economies that import a lot.
- Crowding out: when the government borrows heavily, it can push up interest rates. Private companies then find loans costlier and invest less. This cancels part of the government's push.
Not all spending has the same multiplier
This is the most important point for India:
- Capital expenditure (capex): spending that creates lasting assets, such as roads, railways, ports, power lines and buildings. It gives a push now (jobs, cement, steel) and again later, because the asset keeps raising productivity for years. A good road cuts transport time and cost for every truck that uses it. So capex usually has a high multiplier that grows over time.
- Revenue expenditure: day-to-day spending such as salaries, pensions, interest payments and subsidies. It gives a one-time push to demand but creates no new asset. Its multiplier is usually around or below 1.
- Transfer payments: direct cash given to people, such as cash support schemes. They help households, but part of the money is saved or spent on imports, so the multiplier is also usually around or below 1.
- Tax cuts: these leave more money with people and firms. Their effect depends on whether people spend or save the extra money.
What do Indian studies find?
The most quoted Indian estimates come from a 2013 working paper of the National Institute of Public Finance and Policy (NIPFP) by Sukanya Bose and N.R. Bhanumurthy, titled "Fiscal Multipliers for India" (later published in 2015). It found:
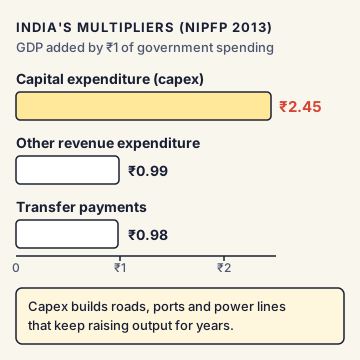
- Capital expenditure multiplier: 2.45. So ₹1 of capex adds about ₹2.45 to GDP.
- Transfer payments multiplier: 0.98.
- Other revenue expenditure multiplier: 0.99.
A 2013 Reserve Bank of India (RBI) working paper by Rajeev Jain and Prabhat Kumar also found that capital outlay has a larger and longer-lasting effect on growth than revenue spending. Different studies give different exact numbers, because they use different methods and time periods. But almost all agree on one ranking: capex gives more growth per rupee than revenue spending.
When is the multiplier bigger or smaller?
- In a slowdown (recession): the multiplier tends to be bigger. Factories and workers are idle, so extra demand is met by producing more, not by raising prices. Research by economists Alan Auerbach and Yuriy Gorodnichenko found government spending multipliers are larger in recessions.
- In a boom: the multiplier tends to be smaller, because the economy is already near full capacity. Extra spending mainly raises prices and interest rates.
- When the central bank keeps interest rates low: crowding out is weaker, so the multiplier is bigger.
- When public debt is already very high: people may expect higher taxes in future and save more, so the multiplier can be smaller.
- When projects are slow or badly chosen: a road that is never finished adds wages for a while but no lasting asset.
India's position and Indian examples
Since the COVID-19 pandemic, the Union government has made capex-led growth its main fiscal strategy. The idea is simple: borrow, but use the borrowing to build assets, not to pay for day-to-day costs.
- The Centre's capital expenditure budget for 2026-27 is about ₹12.2 lakh crore, up from about ₹11.2 lakh crore in 2025-26.
- Effective capital expenditure for 2026-27 (capex plus grants given to states to build assets) is about ₹17.15 lakh crore, roughly 4.4% of GDP. This is more than the fiscal deficit for the year.
- The fiscal deficit target for 2026-27 is 4.3% of GDP, down from 4.4% in 2025-26 (revised).
- The Centre also gives states 50-year interest-free loans for capital investment (the Special Assistance to States for Capital Investment scheme, started in 2020-21), so that states also spend on assets.
- Big programmes such as PM Gati Shakti (a national master plan for linking infrastructure projects) and the National Infrastructure Pipeline are built on the same logic.
The golden rule of public finance supports this approach: a government may borrow to invest in assets, but should pay for day-to-day spending from its own revenue. India's Fiscal Responsibility and Budget Management (FRBM) Act, 2003 set targets for both the fiscal deficit and the revenue deficit, reflecting the same idea.
Commonly confused concepts
- Fiscal multiplier vs money multiplier: The fiscal multiplier is about government spending and GDP. The money multiplier is about banking: how much total money is created in the economy from each rupee of base money issued by the RBI, as banks lend out deposits again and again. Same word, very different ideas.
- Fiscal multiplier vs accelerator: The multiplier says extra spending raises income many times. The accelerator says a rise in income or demand pushes firms to make extra investment (for example, building new factories). Together they explain how a small push can grow into a boom.
- Capital expenditure vs revenue expenditure: Capex creates assets or reduces liabilities (such as repaying a loan). Revenue expenditure does neither. A salary is revenue spending; building a school is capex.
- Fiscal deficit vs revenue deficit: The fiscal deficit is the government's total borrowing need (total spending minus total receipts other than borrowing). The revenue deficit is the gap only on the day-to-day account. A high fiscal deficit with a low revenue deficit means the borrowing is mostly going into assets, which is the "healthier" kind.
- Multiplier vs elasticity: An elasticity measures a percentage response (for example, how many percent tax revenue rises when GDP rises 1%). A multiplier measures a rupee-for-rupee response.
Issues, criticism and the way forward
- Numbers are uncertain: Multiplier estimates vary widely between studies and change over time. Policy should not rest on a single number.
- Quality of projects: A high multiplier is only possible if projects are well chosen, finished on time and maintained. Delays and cost overruns in infrastructure projects shrink the real benefit.
- States matter too: States spend a large share of India's total public capex. When states cut capex to meet deficit limits, the national push weakens.
- Welfare vs growth debate: Supporters of cash transfers argue that poor households spend almost all extra income, so transfers protect consumption and also support demand. Supporters of capex argue it builds long-term capacity. Most experts suggest a balance: targeted transfers for the most vulnerable, and capex for growth.
- Debt sustainability: Even good borrowing must be repaid with interest. India's general government debt is high compared with many emerging economies, so the Union Budget now aims to bring the Centre's debt down to about 50% of GDP by 2030-31. Capex must deliver enough growth to keep debt manageable.
- Way forward suggested by experts: keep shielding capex when cutting deficits; improve project selection and monitoring; crowd in private investment through public-private partnerships; and help states raise their capital spending.
Concepts to Know
- GDP (Gross Domestic Product): The total value of all final goods and services produced inside a country in a year. It is the main measure of the size of an economy.
- Marginal propensity to consume (MPC): Out of each extra rupee you earn, the part you spend. If you spend ₹80 of an extra ₹100, your MPC is 0.8. (Do not confuse with the RBI's Monetary Policy Committee, which uses the same short form.)
- Leakage: Any money that drops out of the spending chain inside the country, such as savings, taxes or spending on imports.
- Crowding out: When heavy government borrowing raises interest rates, private businesses borrow and invest less. Government spending "pushes out" some private spending.
- Keynesian economics: A school of thought based on the work of J.M. Keynes. It says that in a slump, demand is too low, and the government should spend more to revive output and jobs.
- Fiscal deficit: The amount the government must borrow in a year because its spending is more than its income (taxes and other non-debt receipts).
- Effective capital expenditure: The Centre's own capex plus the grants it gives states to create assets. It gives a fuller picture of how much public money is going into building assets.
- Working paper: A research study published by an institution to share findings and invite comments. It is the author's analysis, not official policy.
- Multiplier idea first given by Richard Kahn (Economic Journal, June 1931, employment multiplier)
- Developed by J.M. Keynes in The General Theory (1936) as the investment multiplier
- Simple formula: Multiplier = 1 ÷ (1 − MPC); MPC 0.8 gives 5, MPC 0.9 gives 10
- Leakages: savings, taxes, imports; crowding out reduces the effect further
- NIPFP (Bose and Bhanumurthy, 2013): capex multiplier 2.45; transfer payments 0.98; other revenue expenditure 0.99
- RBI working paper (Jain and Kumar, 2013): capital outlay has a larger, longer-lasting growth effect than revenue spending
- Multipliers are generally larger in recessions and smaller in open, high-import economies
- Union capex 2026-27 (BE): about ₹12.2 lakh crore; effective capex about ₹17.15 lakh crore; fiscal deficit target 4.3% of GDP
- FRBM Act: 2003; debt aim: Centre's debt about 50% of GDP by 2030-31
● Tracked since October 16, 2026 · last seen October 16, 2026 · updates as the daily brief publishes