Climate Risk Index (CRI)
The Climate Risk Index (CRI) is a yearly ranking of countries by how badly they have been hurt by extreme weather, such as floods, cyclones, heatwaves and droughts. It counts how many people died, how many people were affected and how much money was lost. The country with the worst damage gets rank 1. It is published by Germanwatch, a non-profit group based in Germany, and is usually released at the UN climate conference (COP) each year.
Why does it exist?
Climate change makes extreme weather stronger and more frequent. But the damage is not spread equally. Poor countries and small island countries often suffer the most, even though they have released very little of the greenhouse gases that cause climate change. The CRI puts this damage into numbers. This helps poor countries argue for more help at climate talks, especially for adaptation (preparing for climate impacts) and loss and damage (paying for harm that has already happened). It also works as a warning signal for every country to prepare better.
Where did it come from?
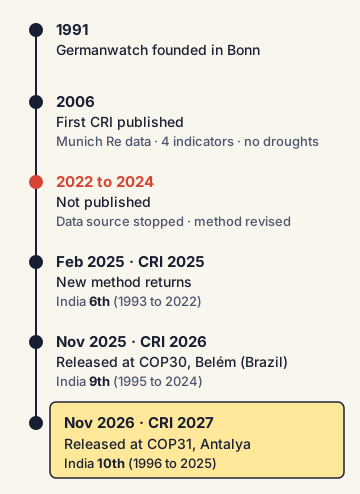
- Germanwatch, founded in 1991 and based in Bonn, first published the CRI in 2006.
- From 2006 to 2021, it used disaster data from Munich Re, a big German insurance company. In those years it had only four indicators and did not include droughts.
- When that data source stopped, the index was not published from 2022 to 2024.
- After a two-year revision, it returned with a new method in CRI 2025 (released February 2025, covering 1993 to 2022). The method was refined again in CRI 2026 (released at COP30 in Belém, Brazil, November 2025, covering 1995 to 2024).
- CRI 2027 was released at COP31 in Antalya on 17 November 2026, covering 1996 to 2025.
What does it measure?
It looks only at sudden, rapid-onset weather disasters. It covers three groups and seven types of hazards:
- Hydrological (water-related): floods, and "wet" mass movements such as landslides and mudslides caused by rain.
- Meteorological (weather-related): storms (including cyclones) and extreme temperatures (heatwaves and cold waves).
- Climatological (climate-related): droughts, wildfires and glacial lake outburst floods.
It does not include slow-onset changes such as sea level rise, melting glaciers or desertification, because their human and money costs are hard to measure. It also leaves out earthquakes, volcanoes and tsunamis, because these are not caused by weather.
How is a country scored?
The CRI uses six indicators: three kinds of damage, each counted in two ways.
- Fatalities (deaths): the total number, and the number relative to population.
- People affected: the total number, and the number relative to population.
- Economic losses: the total amount, and the loss as a share of the country's economy (GDP).
Absolute vs relative, and why it matters
An "absolute" number is the plain total, such as 78,000 deaths. A "relative" number compares the damage with the country's size, such as deaths per 100,000 people. Big countries like India or the US always have large totals. A small island can lose a much bigger share of its people and money in one cyclone.
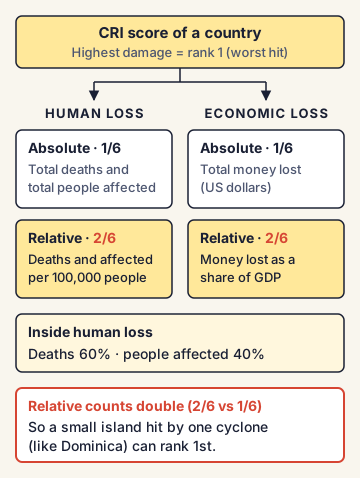
So the CRI gives double weight to relative damage. It groups the six indicators into two parts: human loss (deaths and people affected) and economic loss. In each part, the absolute score gets 1/6 of the total score and the relative score gets 2/6, so each part is worth half (1/6 + 2/6 = 3/6).
Inside the human loss part, deaths get 60% weight and people affected get 40%. These are the weights in the method used since CRI 2026 (CRI 2025 used 1/8 and 3/8). This is why tiny Dominica can rank first while big countries rank lower.
Two rankings in each report
The CRI gives a 30-year ranking (the long-term picture) and a one-year ranking (only the latest year of data, which is the year before the report comes out: for example, 2024 in CRI 2026). Countries at the top of the 30-year list fall into two groups. Some were hit by one huge disaster (like Hurricane Maria in Dominica in 2017 or Cyclone Nargis in Myanmar in 2008). Others, like India and the Philippines, are hit again and again by floods, cyclones and heatwaves every year.
Where does the data come from?
Disaster data comes from EM-DAT (the Emergency Events Database), run by the Centre for Research on the Epidemiology of Disasters (CRED) at the University of Louvain in Belgium. EM-DAT records a disaster only if at least one condition is met: 10 or more deaths, 100 or more people affected, a state of emergency is declared, or there is a call for international help. Population, GDP and price data come from the World Bank and the International Monetary Fund (IMF).
India's position
India is a frequent entry in the CRI's 30-year list, because it faces many disasters every year. Its ranks in the 30-year ranking of the last three reports:
- CRI 2025 (1993 to 2022): India ranked 6th.
- CRI 2026 (1995 to 2024): India ranked 9th, with about 80,000 deaths, about 430 events and about 170 billion US dollars in losses.
- CRI 2027 (1996 to 2025): India ranked 10th, with about 78,000 deaths, 436 events and about 170 billion US dollars in losses.
India's main threats are floods (which affect the most people), cyclones on both coasts, heatwaves in the north and centre, and droughts. Moving down the list (from 6th to 10th) does not always mean India got safer. It can also happen because the 30-year window moves forward one year, dropping an old disaster year and adding a new one.
Commonly confused concepts
- Climate Risk Index (CRI) vs Climate Change Performance Index (CCPI): both involve Germanwatch. The CRI measures damage suffered from extreme weather. The CCPI is a report card on how well countries are cutting emissions and acting on climate. In the CRI, rank 1 is the worst hit. In the CCPI, a rank near the top of the list (a small number) is good.
- CRI vs UNICEF's Children's Climate Risk Index (CCRI): the CCRI (by UNICEF) measures how exposed and vulnerable children are to climate and environmental shocks.
- CRI vs a risk forecast: despite the word "risk", the CRI looks backwards at damage that already happened. It does not predict future disasters.
- Extreme weather events vs slow-onset events: a flood is sudden and short; sea level rise is slow and takes decades. The CRI counts only the first type.
Issues, criticism and the way forward
- Underreporting: deaths from heatwaves are badly recorded, especially in Africa and South Asia. EM-DAT records almost no heatwave deaths in Sub-Saharan Africa, though heatwaves happen there. So the true damage is likely higher.
- Changing methods: because the method changed with CRI 2025 (and was refined again in CRI 2026), ranks from editions before CRI 2025 cannot be fairly compared with the new ones.
- Attribution: the CRI counts all weather disasters. It does not say how much of each disaster was caused by climate change.
- Way forward: experts say the index should be used with better national disaster data, early warning systems, climate-proof infrastructure, and money from rich countries for adaptation and loss and damage.
Concepts to Know
- Extreme weather event: A weather event that is much stronger than normal, such as a very heavy flood, a strong cyclone or a deadly heatwave.
- Adaptation: Steps to live with climate change and reduce its harm, such as building cyclone shelters or growing heat-tolerant crops.
- Mitigation: Steps to reduce the causes of climate change, mainly by cutting greenhouse gas emissions.
- GDP (Gross Domestic Product): The total value of all goods and services a country produces in a year. Losses "as a share of GDP" show how big the damage is compared with the size of the economy.
- COP (Conference of the Parties): The yearly meeting of countries that have joined the UN climate treaty (UNFCCC). COP31 is the 31st such meeting.
- Publisher: Germanwatch (Bonn, Germany; founded 1991); first CRI in 2006
- Not published 2022 to 2024; new method from CRI 2025; data from EM-DAT (CRED, Belgium), World Bank and IMF
- Six indicators: deaths, people affected and economic losses, each in absolute and relative terms
- Weights (since CRI 2026): human loss and economic loss each get 1/6 for the absolute score and 2/6 for the relative score; within human loss, deaths 60% and people affected 40%
- EM-DAT inclusion: 10+ deaths, or 100+ affected, or state of emergency, or call for international help
- Excludes slow-onset events and geological events (earthquakes, volcanoes, tsunamis)
- India (30-year ranking): 6th (CRI 2025), 9th (CRI 2026), 10th (CRI 2027)
● Tracked since November 18, 2026 · last seen November 18, 2026 · updates as the daily brief publishes