Variable Renewable Energy (VRE) and Grid Integration
Some kinds of clean electricity, like solar and wind, depend on the weather. The sun sets every evening, clouds pass, and the wind rises and falls. Power from such sources is called variable renewable energy (VRE). Grid integration means all the steps needed to fit this up-and-down power into the electricity grid safely, so that lights stay on even when the sun or wind is not available.
Why does it matter?
An electricity grid must balance supply and demand every single second. If power plants produce less than people use, the grid weakens and can collapse into a blackout. Coal, gas, nuclear and big hydro plants can be switched up or down as needed, so they are called dispatchable sources. Solar and wind cannot be ordered to produce more.
As their share grows, the grid needs new tools to stay balanced. Think of a family budget: if half your income comes on random days, you need savings and planning to pay bills on time.
How does the grid stay balanced?
Every Indian grid runs at a frequency of 50 hertz (Hz). Frequency is like the grid's heartbeat. If supply drops below demand, the frequency falls. If supply is more than demand, it rises. Grid operators try to keep it within a narrow band of 49.90 to 50.05 Hz. Big spinning generators in coal and hydro plants help here, because their heavy rotating parts resist sudden changes.
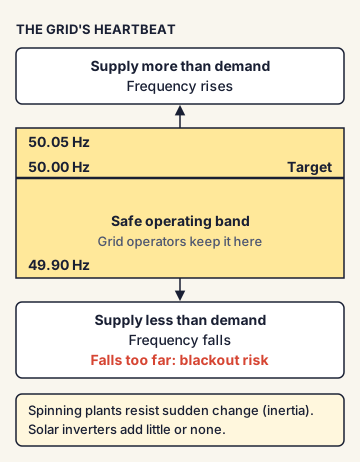
This natural resistance is called inertia. Solar panels and most wind turbines connect through electronic devices called inverters and add little or no inertia. So a grid with a lot of solar needs other ways to stay steady.
What problems does variable power create?
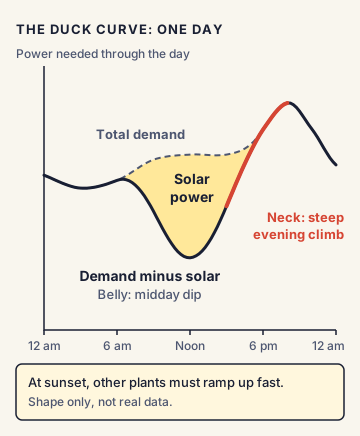
- Daily swings: Solar output is highest at noon and zero at night. But demand in India often peaks in the evening. So the grid must ramp up other plants very fast when the sun sets.
- The duck curve: If you plot demand minus solar output through the day, the graph dips at midday and shoots up in the evening. It looks like a duck. California's grid operator first described it in 2013.
- Seasonal swings: In India, wind is very strong in the monsoon months (roughly June to September) and weak for the rest of the year. Solar falls during the cloudy monsoon. So the two do not always fill each other's gaps.
- Location mismatch: The best solar and wind sites are in states like Rajasthan, Gujarat and Tamil Nadu. Demand is spread across the country. Power must travel long distances.
- Forecast errors: If a cloud or a drop in wind is not predicted, the grid can suddenly fall short.
- Curtailment: When there is more solar or wind power than the grid can use or carry, operators order plants to cut output. The clean power is wasted.
How is VRE fitted into the grid? The main tools
- Energy storage: Store extra power and release it later. Battery Energy Storage Systems (BESS) respond in milliseconds and are good for a few hours. Pumped storage hydropower pumps water uphill when power is cheap and lets it flow down through turbines when power is needed.
- Stronger transmission: More and bigger power lines move clean power from sunny and windy states to cities. India's Green Energy Corridor programme builds such lines.
- A larger, connected grid: A big grid can share power between regions. When it is windy in the south and sunny in the west, the whole country benefits.
- Better forecasting and scheduling: Wind and solar plants must forecast their output and pay charges if they deviate too much from their schedule.
- Flexible conventional plants: Coal and gas plants run at lower output at noon and ramp up in the evening.
- Hybrid and round-the-clock projects: Putting wind, solar and storage together at one site gives a steadier supply.
- Demand response: Shifting some demand, like farm water pumps or electric vehicle charging, to the sunny hours.
- Grid-forming inverters: Advanced inverters that can copy some of the steadying behaviour of spinning generators.
Where did India's approach come from?
India once had five separate regional grids: Northern, Eastern, Western, North-Eastern and Southern. They were joined step by step. On 31 December 2013, the Southern grid was synchronised with the rest through the 765 kV Raichur-Solapur line. This created "One Nation, One Grid, One Frequency", one of the largest synchronised grids in the world. In August 2015, the Central Electricity Regulatory Commission (CERC) notified a framework for forecasting, scheduling and deviation settlement for wind and solar plants selling power between states.
In May 2018, MNRE issued the National Wind-Solar Hybrid Policy. Under it, a plant counts as a hybrid when one source's rated capacity is at least 25% of the other's.
India's position and Indian examples
- Renewable growth: As of 31 July 2026, India had 300.50 GW of non-fossil capacity, including 164.59 GW solar and 58.14 GW wind. This was more than half of its total installed capacity of about 552 GW.
- Battery storage support: In September 2023, the Union Cabinet approved a Viability Gap Funding (VGF) scheme for battery storage. In June 2025, the Ministry of Power announced a second tranche of ₹5,400 crore to support 30 GWh of BESS, funded through the Power System Development Fund at ₹18 lakh per MWh.
- Storage needs: The Central Electricity Authority (CEA) estimates India needs 37 GWh of battery storage by 2027 and 236 GWh by 2031-32.
- Pumped storage: About 7.4 GW of pumped storage was operating as of August 2026, with India targeting 100 GW by 2035-36.
- Firm and dispatchable renewable energy (FDRE) tenders: Government agencies now auction projects that must supply power at fixed times, including evening peaks, using solar, wind and storage together.
Commonly confused concepts
- Installed capacity vs generation: Capacity (in GW) is the maximum a plant can produce at one moment. Generation (in units, or kWh) is how much electricity it actually produces over time. A 100 MW solar plant does not produce 100 MW at night. So a high share of renewable capacity does not mean an equally high share of electricity generated.
- Capacity utilisation factor (CUF): The actual output of a plant compared with its maximum possible output over a year. Solar in India usually has a much lower CUF than a coal plant.
- Variable vs intermittent: "Variable" means output changes with the weather. "Intermittent" stresses that it can stop altogether, like solar at night. Both terms are often used for solar and wind.
- Dispatchable vs non-dispatchable: A dispatchable source can be switched on, off, up or down on command (coal, gas, hydro with a reservoir). Solar and wind alone are non-dispatchable.
- Battery storage vs pumped storage: Both store electricity. Batteries are quick to build and respond instantly but usually store power for 2 to 4 hours. Pumped storage takes years to build but can store large amounts for longer and lasts for decades.
Issues, criticism and the way forward
- Transmission delays: Lines often take longer to build than solar parks, leaving clean power stranded. Land acquisition and right-of-way problems slow work.
- Discom finances: State distribution companies are often in debt and delay payments. This makes investors cautious.
- Grid safety: Very high renewable shares with little inertia can make grids fragile. The blackout in Spain and Portugal on 28 April 2025 was traced mainly to voltage control failures, which started a debate on how high-renewable grids must be managed. Official reports did not blame renewables alone.
- Storage cost and supply: Batteries depend on imported lithium and other critical minerals.
- Coal plant flexibility: Old coal plants are not built to ramp up and down every day.
- Way forward: Experts and official plans point to faster transmission, large storage additions, better forecasting, market reforms that pay for flexibility, hybrid projects and stronger regional power sharing.
Concepts to Know
- Gigawatt (GW): A unit of power capacity. 1 GW = 1,000 megawatts (MW). One GW of solar can roughly power several lakh homes during the day.
- Frequency (Hz): How many times per second alternating current changes direction. In India it is 50 times per second. A stable frequency shows supply and demand are balanced.
- Inertia: The resistance of heavy spinning machines to sudden change, which keeps the grid steady for a few seconds after a fault.
- Inverter: A device that converts the direct current (DC) from solar panels or batteries into alternating current (AC) used by the grid.
- Discom: A distribution company that buys power and supplies it to homes and businesses in a state.
- Curtailment: Ordering a power plant to cut its output because the grid cannot use or carry the power.
- Viability Gap Funding (VGF): A government grant that covers part of a project's cost so that it becomes financially workable.
- Synchronised grid: A grid where all generators run at the same frequency, so power flows freely between regions.
- Indian grid frequency: 50 Hz; operating band 49.90 to 50.05 Hz
- "One Nation, One Grid, One Frequency": achieved 31 December 2013 (Southern grid linked via 765 kV Raichur-Solapur line)
- CERC framework on forecasting, scheduling and deviation settlement for wind and solar: August 2015
- National Wind-Solar Hybrid Policy: May 2018; hybrid = one source at least 25% of the other's rated capacity
- BESS VGF: first scheme approved September 2023; second tranche (June 2025) ₹5,400 crore for 30 GWh, at ₹18 lakh per MWh
- CEA battery storage need: 37 GWh by 2027, 236 GWh by 2031-32
- Non-fossil capacity: 300.50 GW as of 31 July 2026 (solar 164.59 GW, wind 58.14 GW)
- Duck curve: first described by California's grid operator in 2013
● Tracked since November 06, 2026 · last seen November 07, 2026 · updates as the daily brief publishes