Multidimensional Poverty Index (MPI)
Measuring Poverty Beyond Income
The Multidimensional Poverty Index, or MPI, is a way of measuring poverty by looking at what people actually lack in their daily lives, not only how much money they earn. It checks 10 basic things in three areas: health, education and living standards. If a person lacks enough of these things at the same time, the MPI counts them as poor.
The Global MPI is produced every year by the UNDP and Oxford University, and India also has its own National MPI made by NITI Aayog.
Why measure poverty this way?
For a long time, poverty was measured only by income or spending. A family was poor if it spent less than a fixed amount of money per person. But money alone does not show the full picture. Think of two families earning the same income. One lives near a free government school and a clean water tap.
The other has no school nearby, drinks dirty water and cooks with firewood that fills the house with smoke. On paper, both earn the same, but the second family is clearly worse off. The MPI was built to catch these hidden hardships. It also shows the government which hardship is biggest in which place, so it can target help better.
Where did it come from?
- In 1997, the UNDP's Human Development Report introduced the Human Poverty Index (HPI), an early attempt to measure poverty beyond income.
- In 2010, the Human Development Report replaced the HPI with the Global MPI. It was developed by OPHI (a research centre at the University of Oxford) together with the UNDP's Human Development Report Office (HDRO).
- The MPI uses a counting method created by economists Sabina Alkire and James Foster, known as the Alkire-Foster method.
- Since 2018, the HDRO and OPHI jointly produce and publish the Global MPI estimates every year.
- The MPI is closely linked to Sustainable Development Goal (SDG) 1, "end poverty in all its forms everywhere". SDG target 1.2 asks countries to at least halve the share of people living in poverty "in all its dimensions" by 2030.
What does the Global MPI check?
It has 3 dimensions with equal weight (one-third each) and 10 indicators:
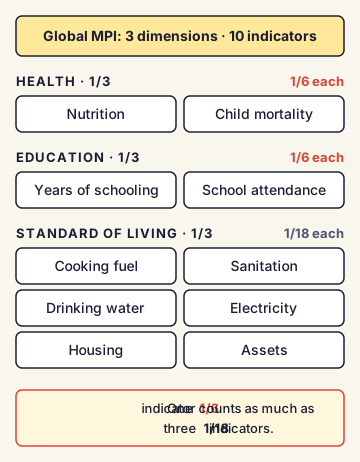
- Health (1/3):
- Nutrition (weight 1/6): deprived if any adult or child in the household with nutrition data is undernourished.
- Child mortality (weight 1/6): deprived if any child under 18 died in the household in the five years before the survey.
- Education (1/3):
- Years of schooling (weight 1/6): deprived if no household member has completed six years of schooling.
- School attendance (weight 1/6): deprived if any school-age child is not going to school (up to the age of class 8).
- Standard of living (1/3): six indicators, each with weight 1/18:
- Cooking fuel: deprived if the household cooks with dung, wood, charcoal or similar fuels.
- Sanitation: deprived if the toilet is not improved or is shared with other households.
- Drinking water: deprived if water is not from a safe source, or the source is more than a 30-minute walk (round trip) away.
- Electricity: deprived if the house has no electricity.
- Housing: deprived if the floor, roof or walls are made of poor materials (like mud floors or thatch).
- Assets: deprived if the household owns not more than one small asset (such as a radio, TV, phone, bicycle, motorbike or fridge) and has no car or truck.
All 10 indicators for a country come from the same household survey. In India, this survey is the National Family Health Survey (NFHS).
How does the counting work?
Let us follow one household step by step.
- Check each indicator. For each of the 10 indicators, mark whether the household is deprived (lacks it) or not.
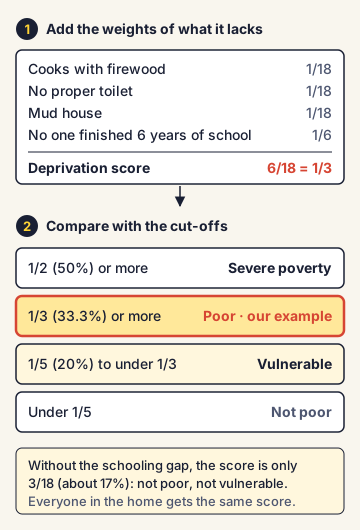
- Add up the weights. Add the weights of all the indicators in which it is deprived. This total is the household's deprivation score. Every person in the household gets the same score.
- Compare with the cut-offs:
- Score of 1/3 (33.3%) or more: the person is multidimensionally poor.
- Score of 1/5 (20%) or more, but less than 1/3: the person is vulnerable to multidimensional poverty.
- Score of 1/2 (50%) or more: the person is in severe multidimensional poverty.
A simple example: a household cooks with firewood (1/18), has no proper toilet (1/18), lives in a mud house (1/18), and no adult has finished six years of school (1/6). Its score is 3/18 + 3/18 = 6/18 = 1/3. So everyone in that household counts as multidimensionally poor. If the same family only lacked the three living-standard items, its score would be 3/18 (about 17%), so it would not be poor or vulnerable.
How is the final MPI number made?
The MPI value combines two things:
- Headcount ratio (H): the share of people who are poor. This answers "how many are poor?"
- Intensity (A): the average deprivation score among the poor. This answers "how poor are the poor?"
- MPI = H × A. It runs from 0 (no one is poor) to 1 (everyone is poor in every indicator).
Why multiply? Suppose a poor family gets a gas connection. It may still be counted as poor, so H does not change. But it now lacks fewer things, so A falls, and the MPI falls too. This way, the MPI rewards progress even for people who are still poor.
India in the Global MPI
As of the 2026 update (based on NFHS-5, 2019-21):
- Headcount: 16.4% (about 237.8 million people in 2024)
- Intensity: 42.0%
- MPI value: 0.069
- Vulnerable: 18.7% (about 271.1 million people)
- Severe poverty: 4.2%
- Contribution to poverty: health 32.2%, education 28.2%, standard of living 39.7%
- Neighbours: Bangladesh MPI 0.067 (headcount 14.9%), Pakistan 0.198 (38.3%); South Asia average 0.090 (19.9%)
Over time, India's headcount fell from 55.1% in 2005-06 to 16.4% in 2019-21. The Global MPI 2023 estimated that about 415 million people in India moved out of multidimensional poverty in these 15 years, one of the largest falls recorded anywhere.
India's own National MPI (NITI Aayog)
India also makes its own version, published by NITI Aayog with technical help from OPHI and UNDP.
- It uses the same 3 dimensions but 12 indicators. It adds maternal health (under health) and bank account (under living standards) to the 10 global indicators. Child mortality is widened to "child and adolescent mortality".
- Baseline report (November 2021): based on NFHS-4 (2015-16).
- Progress Review (July 2023): poverty fell from 24.85% in 2015-16 to 14.96% in 2019-21. About 13.5 crore people moved out of poverty. Rural poverty fell from 32.59% to 19.28%, and urban poverty from 8.65% to 5.27%.
- Discussion paper (January 2024): using projected estimates, it said poverty fell from 29.17% in 2013-14 to 11.28% in 2022-23, and about 24.82 crore people escaped poverty in nine years. Uttar Pradesh saw the largest number exit (5.94 crore), followed by Bihar (3.77 crore) and Madhya Pradesh (2.30 crore).
- The National MPI is also used in NITI Aayog's SDG India Index to track SDG 1 across states.
Commonly confused concepts
- MPI vs income poverty line: An income poverty line asks, "Does this person spend or earn below a fixed amount of money?" (for example, the World Bank's line of $3.00 a day at 2021 prices). The MPI asks, "Does this person lack basic things like nutrition, schooling and clean fuel?" In India, the share below the $3.00 line was 5.3%, while the MPI headcount was 16.4%. So many people above the money line still lack basic services.
- MPI vs Human Development Index (HDI): The HDI measures a country's average achievement in life expectancy, education and income per person (gross national income). It says how well the country is doing overall. The MPI looks at individual households and counts who is left behind. Both are published by the UNDP.
- MPI vs HPI: The Human Poverty Index (1997-2009) used country averages. The MPI (2010 onwards) uses household survey data, so it can show who is deprived in what, together.
- Global MPI vs National MPI: The Global MPI (UNDP-OPHI) has 10 indicators and lets you compare more than 100 countries. India's National MPI (NITI Aayog) has 12 indicators and is designed for Indian policy, with state and district figures.
- Headcount (H) vs Intensity (A) vs MPI value: H is how many are poor; A is how poor they are on average; MPI is H × A.
- "Vulnerable" vs "poor" vs "severe": vulnerable = score 20% to under 33.3%; poor = 33.3% or more; severe = 50% or more.
Issues, criticism and the way forward
- Old data: The Global MPI 2026 still uses India's NFHS-5 (2019-21) data. So the 2024 figure of 238 million is the 2019-21 poverty rate applied to the 2024 population, not a fresh count. The fact sheets of NFHS-6 (2023-24) came out in 2026, but the full survey data needed for the MPI was not yet public. Faster release of survey data would give a truer picture.
- Access, not quality: The index checks whether a child goes to school, not whether the child learns. It checks whether a toilet exists, not whether it is used. So real deprivation can be hidden.
- Missing areas: The global MPI does not include work, income security, safety or the quality of health care. A family may have a pucca house and a gas connection but still face hunger when work stops.
- Projections and debate: NITI Aayog's 2022-23 estimates used projections because new survey data was not available for those years. Some economists questioned these numbers; the government says the method is transparent and backed by OPHI and UNDP.
- Weights are a choice: Giving equal weight to the three dimensions is a judgement, not a natural law. Different weights would give different rankings.
- Household-level hides inequality inside the home: All members of a household get the same score, so the index cannot show if women or girls in the same home are worse off.
- Way forward: Experts suggest timely and regular surveys, adding quality-based indicators (learning levels, health care quality), and using the MPI together with income and consumption measures. Since living standards contribute the most to India's poverty, schemes on housing, clean cooking fuel, sanitation and water remain central to further progress.
Concepts to Know
- Deprivation: Lacking something basic that a person needs for a decent life, such as enough food, safe water or schooling.
- Weight: How much an indicator counts in the total score. A weight of 1/6 counts three times as much as a weight of 1/18.
- Deprivation score: The total of the weights of all the indicators in which a household is deprived. If it reaches 1/3, the household is counted as poor.
- Purchasing power parity (PPP): A way of comparing money across countries by asking how much the same basket of goods costs in each country. "$3.00 a day at 2021 PPP" means the amount of money that buys in India what $3.00 bought in the US in 2021.
- Alkire-Foster method: A counting method that first checks each person on many indicators, then adds them up with weights, and finally uses a cut-off to decide who is poor.
- SDG (Sustainable Development Goals): 17 global goals adopted by the UN in 2015, to be met by 2030. SDG 1 is "No Poverty".
- Global MPI launched: 2010 (Human Development Report), by UNDP and OPHI (University of Oxford); replaced the Human Poverty Index (1997)
- Method: Alkire-Foster counting method
- Structure: 3 dimensions, 10 indicators; health and education indicators weighted 1/6 each, living-standard indicators 1/18 each
- Cut-offs: poor ≥ 1/3; vulnerable 1/5 to under 1/3; severe ≥ 1/2
- MPI = H (headcount) × A (intensity); ranges from 0 to 1
- 2026 Statistical Update: 108 countries
- India (Global MPI 2026, NFHS-5 data): headcount 16.4%, intensity 42.0%, MPI 0.069, vulnerable 18.7%, severe 4.2%
- India trend: 55.1% (2005-06) → 16.4% (2019-21); about 415 million exited poverty in 15 years (Global MPI 2023)
- NITI Aayog National MPI: 12 indicators (adds maternal health and bank account); baseline 2021; Progress Review 2023 (24.85% → 14.96%, 13.5 crore exited); discussion paper 2024 (29.17% in 2013-14 → 11.28% in 2022-23, 24.82 crore exited)
- Linked to SDG target 1.2 (halve poverty in all its dimensions by 2030)
● Tracked since October 15, 2026 · last seen October 15, 2026 · updates as the daily brief publishes