Global Hunger Index (GHI)
The Global Hunger Index is a yearly report that measures and compares hunger in countries around the world. It gives each country a single score from 0 to 100. A lower score is better: 0 means no hunger and 100 is the worst. The score is built from four indicators: how many people do not get enough food, how many young children are too short or too thin, and how many die before their fifth birthday.
Why does it exist?
"Hunger" is not just an empty stomach on one day. A child can eat every day and still not grow properly, because the food lacks nutrients. So no single number can show hunger fully. The GHI joins four different measures into one score. This lets the world see which countries are doing badly, track progress over years, and push governments to act. It also tracks progress toward the UN's Sustainable Development Goal 2 (Zero Hunger) by 2030.
Where did it come from?
The GHI was developed by the International Food Policy Research Institute (IFPRI) together with Welthungerhilfe, a German aid organisation. The first report came out in 2006. Concern Worldwide, an Irish aid organisation, joined as a co-publisher in 2007. In recent years the report has been prepared by these aid groups along with an academic partner, the Institute for International Law of Peace and Armed Conflict (IFHV) in Germany. The report comes out every October, around World Food Day (16 October).
The four indicators and their weights
| Indicator | What it measures | Share of the score |
|---|---|---|
| Undernourishment | Share of the whole population that does not get enough calories regularly | 1/3 |
| Child stunting | Share of children under 5 who are too short for their age | 1/6 |
| Child wasting | Share of children under 5 who are too thin for their height | 1/6 |
| Child mortality | Share of children who die before their fifth birthday | 1/3 |
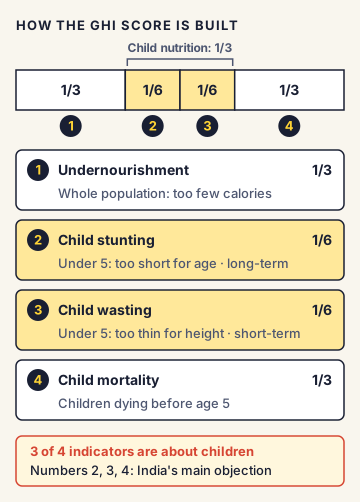
So the score looks at three things: not enough food for everyone (undernourishment), poor nutrition in children (stunting and wasting, together one-third), and the worst outcome of hunger and disease (child deaths).
What do stunting and wasting really mean?
- Stunting is low height for age. It shows long-term (chronic) undernutrition: a child who did not get enough nutrition for months or years, often starting in the mother's womb. Stunting harms brain development and cannot be fully reversed after about age two.
- Wasting is low weight for height. It shows short-term (acute) undernutrition: a sudden loss of weight, often from a recent illness like diarrhoea, or a period of very little food. Wasting greatly raises the risk of death.
- A child is counted as stunted or wasted if they fall well below (more than two "standard deviations" below) the World Health Organization's growth standards for healthy children.
How is the score calculated?
Each of the four values is first converted to a common 0 to 100 scale. Then they are combined using the weights above to give one score. The data come from international bodies: undernourishment from the UN's Food and Agriculture Organization (FAO), child stunting and wasting mainly from joint UNICEF, WHO and World Bank estimates and national surveys, and child mortality from UN estimates.
The severity scale
- Low: 9.9 or less
- Moderate: 10.0 to 19.9
- Serious: 20.0 to 34.9
- Alarming: 35.0 to 49.9
- Extremely alarming: 50.0 or more
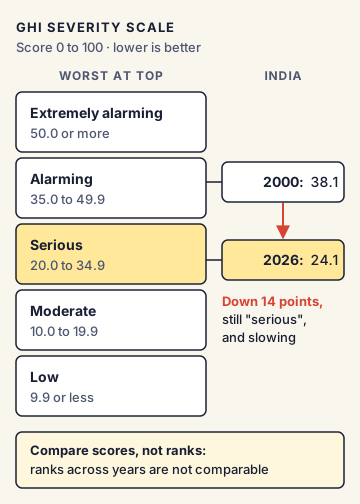
Important: ranks are not comparable across years
Each year the data are revised, the list of countries changes, and the method may change. So the GHI report itself warns against comparing one year's rank with another year's rank. To see real progress, compare the scores calculated in the same report for different reference years.
India's position
India's score has fallen from 38.1 in 2000 to 24.1 in 2026. That is real progress, but it has slowed. The score dropped by 8.2 points between 2006 and 2012, but only about 1.7 points between 2018 and 2026.
| Year of report | India's rank | Countries ranked | Score |
|---|---|---|---|
| 2022 | 107 | 121 | 29.1 |
| 2023 | 111 | 125 | 28.7 |
| 2024 | 105 | 127 | 27.3 |
| 2025 | 102 | 123 | 25.8 |
| 2026 | 100 | 122 | 24.1 |
India's indicator values in GHI 2026 tell a mixed story:
- Undernourishment: 18.1% (2000-02) down to 9.8%
- Child stunting: 50.0% (2000-02) down to 29.3%, moving from a "very high" to a "high" level for the first time
- Child mortality: 9.2% (2000-02) down to 2.7%
- Child wasting: 17.9% (2000-02), and now 19.0%, which is higher than at the start
India's main programmes against hunger
The National Food Security Act, 2013 gives subsidised grain to up to 75% of the rural and 50% of the urban population. Since 1 January 2024, this grain is free under the Pradhan Mantri Garib Kalyan Anna Yojana for five years. Mission Saksham Anganwadi and Poshan 2.0 provides food, health checks and nutrition counselling to young children and mothers through anganwadi centres. PM POSHAN gives hot cooked meals to school children.
Commonly confused concepts
- GHI vs Global Food Security Index (GFSI): The GFSI was prepared by Economist Impact. It measures whether food is affordable, available and safe in a country, not how many people are actually hungry.
- GHI vs SOFI report: The State of Food Security and Nutrition in the World (SOFI) is published by UN agencies led by the FAO. It is the source of the undernourishment figures. It gives data, not a single ranked score like the GHI.
- GHI vs Multidimensional Poverty Index (MPI): The MPI measures poverty across health, education and living standards. The GHI measures only hunger and nutrition.
- Stunting vs wasting vs underweight: Stunting = too short for age (long-term). Wasting = too thin for height (short-term). Underweight = too light for age (a mix of both). The GHI uses stunting and wasting, not underweight.
- Hunger vs malnutrition: Hunger usually means not getting enough calories. Malnutrition is wider: it includes undernutrition (too little) and also overweight and obesity (too much or the wrong kind of food).
Issues, criticism and the way forward
- The Indian government's objections: The Ministry of Women and Child Development has called the GHI "a deeply flawed measure of hunger". It points out that three of the four indicators are about children, so the index cannot represent the whole population. It has also said the undernourishment figure for India rests on a small sample collected through an opinion poll. In 2023, it said child wasting on its own Poshan Tracker app was consistently below 7.2%, compared with 18.7% used in that year's GHI.
- The other side: Researchers and fact-checkers reply that stunting and wasting are standard indicators used worldwide, including for SDG target 2.2. They note that India's own survey shows high levels too: the National Family Health Survey-5 (2019-21) found 35.5% stunting, 19.3% wasting and 32.1% underweight among children under five. They also say wasting is linked not only to food but to illness, poor sanitation and the mother's health.
- Why wasting stays high: Experts point to low birth weight, poor nutrition of mothers, poor feeding of infants, diarrhoea from unsafe water, and weak care for children who are already severely wasted.
- Way forward: Suggested steps include better nutrition for adolescent girls and pregnant women, promoting breastfeeding, a more diverse diet beyond rice and wheat (pulses, eggs, milk, vegetables), safe water and toilets, community treatment of severely wasted children, and more frequent, reliable national data.
Concepts to Know
- Undernutrition: When the body does not get enough energy or nutrients to grow and stay healthy. It shows up as stunting, wasting or underweight.
- Standard deviation: A statistical measure of how far a value is from the average. "More than two standard deviations below" means far below what is normal for healthy children of that age or height.
- Sustainable Development Goals (SDGs): 17 global goals adopted by the UN in 2015, to be met by 2030. Goal 2 is "Zero Hunger".
- Poshan Tracker: A mobile app launched by the Ministry of Women and Child Development on 1 March 2021. Anganwadi workers use it to record children's height and weight and the services given.
- Anganwadi: A village or slum centre run under the government's child development programme. It gives food, pre-school learning and health support to young children and mothers.
- First published 2006; developed by IFPRI with Welthungerhilfe; Concern Worldwide joined in 2007
- Four indicators: undernourishment (1/3), child stunting (1/6), child wasting (1/6), under-5 mortality (1/3)
- Scale 0 to 100; Low ≤9.9, Moderate 10.0-19.9, Serious 20.0-34.9, Alarming 35.0-49.9, Extremely alarming ≥50.0
- India GHI 2026: rank 100 of 122, score 24.1, "serious"; score in 2000 was 38.1
- India 2026 indicators: undernourishment 9.8%, stunting 29.3%, wasting 19.0%, child mortality 2.7%
- Ranks from different years should not be compared directly
- NFHS-5 (2019-21): stunting 35.5%, wasting 19.3%, underweight 32.1%
● Tracked since November 02, 2026 · last seen November 02, 2026 · updates as the daily brief publishes