Gini Coefficient
How Economists Measure Inequality
The Gini coefficient is a single number that shows how unequally income, spending or wealth is shared among the people of a country. It runs from 0 to 1 (or 0 to 100 when written as the Gini index). 0 means perfect equality: everyone has exactly the same. 1 (or 100) means perfect inequality: one person has everything and everyone else has nothing. So a lower Gini means a more equal society.
Why do we need it?
Poverty numbers tell us how many people are below a line. But they do not tell us how the total pie is shared. A country can reduce poverty and still become more unequal, if the rich get richer much faster than the poor. Governments, the World Bank and researchers need one simple number to compare inequality across years and countries. The Gini coefficient does this job. It helps answer questions like: "Is growth reaching everyone, or only the top?"
Where did it come from?
- In 1905, the American economist Max O. Lorenz drew a graph to show how income is shared. It is now called the Lorenz curve.
- In 1912, the Italian statistician Corrado Gini published a measure of how spread out values are, in a work titled Variabilità e mutabilità ("Variability and Mutability"). This became the Gini coefficient.
- Later, statisticians showed how Gini's measure can be read directly from the Lorenz curve. Today the World Bank, the OECD and the UN all publish Gini figures.
How does it work? The Lorenz curve
Imagine lining up all the people of a country from poorest to richest. Now ask: "What share of total income do the poorest 10% have? The poorest 20%? The poorest 50%?" and so on.
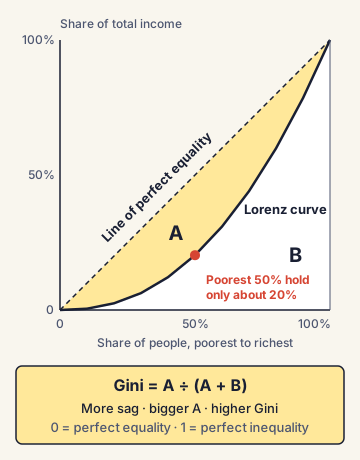
- On a graph, the horizontal axis shows the share of people (from 0% to 100%, poorest first).
- The vertical axis shows the share of total income they hold together.
- If everyone earned the same, the poorest 20% would have 20% of income, the poorest 50% would have 50%, and so on. This gives a straight diagonal line, called the line of perfect equality.
- In real life, the poorest 50% may hold only 15% or 20% of income. So the real curve (the Lorenz curve) sags below the diagonal.
From the curve to the number
The Gini coefficient is the area between the line of equality and the Lorenz curve, divided by the whole area under the line of equality. The more the curve sags, the bigger this gap, and the higher the Gini.
- Simple example: in a village of 10 families, if each has ₹10,000, the Lorenz curve sits on the diagonal and Gini = 0.
- If one family has ₹1,00,000 and the other nine have nothing, the curve hugs the bottom and Gini is close to 1.
Consumption Gini vs income Gini vs wealth Gini
The same tool can be used on three different things, and the results differ a lot.
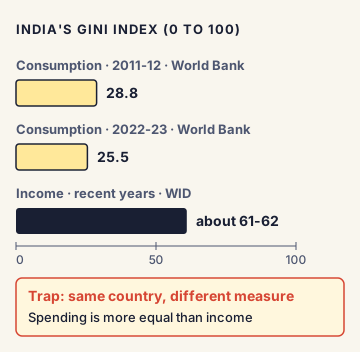
- Consumption Gini: based on what households spend. Spending is more equal than income, because the rich save a lot and the poor spend almost everything. India's official surveys measure consumption, so India's World Bank Gini is a consumption Gini.
- Income Gini: based on what people earn. Most rich countries report this.
- Wealth Gini: based on what people own (land, houses, shares, gold). Wealth is usually far more unequal than income.
India's numbers
- According to the World Bank's Spring 2025 brief, India's consumption-based Gini index improved from 28.8 in 2011-12 to 25.5 in 2022-23.
- In July 2025, a government release said this made India the fourth most equal country in the world, after the Slovak Republic, Slovenia and Belarus. Critics pointed out that this compared India's consumption Gini with other countries' income Ginis, which is not a like-for-like comparison. The World Bank itself warned that inequality in India may be underestimated because of data limits.
- The World Inequality Database, which combines surveys, tax data and national accounts, puts India's income Gini much higher, at about 61-62 in recent years. Its World Inequality Report 2026 said the top 10% of earners in India receive about 58% of national income, while the bottom 50% get about 15%.
Other measures of inequality
UPSC may ask about these:
- Palma ratio: the income share of the top 10% divided by the income share of the bottom 40%. It was proposed by the Chilean economist José Gabriel Palma, who noticed that the middle 50% (deciles 5 to 9) usually hold about half of national income in most countries. So inequality is mostly about the two ends.
- Decile ratio (P90/P10): the income at the 90th percentile divided by the income at the 10th percentile. The "13 times" earnings gap in India is a measure of this type.
- Top income shares: the share of total income going to the top 1% or top 10%.
- Kuznets curve: a theory by Simon Kuznets (1950s) that inequality first rises as a country industrialises and later falls, making an inverted-U shape. Later data from many countries has not always supported this.
Commonly confused concepts
- Gini coefficient vs Gini index: Same idea. The coefficient is written from 0 to 1 (0.255); the index is the same number multiplied by 100 (25.5).
- Higher Gini vs lower Gini: A higher number means more inequality. Students sometimes reverse this.
- Lorenz curve vs line of equality: The straight diagonal is the line of equality; the bent line below it is the Lorenz curve. The Lorenz curve can never go above the diagonal.
- Poverty vs inequality: Poverty is about how many people are below a minimum level. Inequality is about how the total is shared. A country can be rich and unequal, or poor and fairly equal.
- Gini vs Human Development Index (HDI): HDI (by UNDP) measures health, education and income levels. The Inequality-adjusted HDI (IHDI) lowers a country's HDI to reflect inequality in these areas. Gini looks only at the distribution of one variable.
Issues, criticism and the way forward
- Data choice changes the story: India's consumption Gini looks low, but income and wealth Ginis look very high. Rich households are also less likely to answer surveys fully, so surveys miss much of the top.
- One number hides the shape: Two countries can have the same Gini but very different patterns (one with a very rich top, another with a very poor bottom). This is why the Palma ratio and top-share data are used alongside it.
- Not sensitive where it matters: The Gini changes most with shifts in the middle of the distribution, and less with changes at the very top or bottom.
- Way forward: Experts suggest publishing an official income survey, using tax and survey data together, releasing consumption surveys regularly, and tracking several measures (Gini, Palma, top shares) side by side. Policies often discussed to reduce inequality include better public education and health, more jobs in labour-intensive manufacturing, and well-targeted welfare.
Concepts to Know
- Percentile and decile: If people are lined up from poorest to richest and split into 100 equal groups, each is a percentile; split into 10 equal groups, each is a decile. The "top 10%" is the top decile.
- Median: The middle value when all values are lined up. Half the people earn more, half earn less. Unlike the average, it is not pulled up by a few very rich people.
- National accounts: The official system of measuring GDP and national income, run in India by the National Statistics Office.
- World Inequality Database (WID): A research database run by the World Inequality Lab (Paris School of Economics), which publishes the World Inequality Report.
- Gini range: 0 (perfect equality) to 1 (perfect inequality); Gini index = coefficient × 100
- Lorenz curve: Max O. Lorenz, 1905; Gini measure: Corrado Gini, 1912
- Gini = area between line of equality and Lorenz curve ÷ total area under the line of equality
- India's consumption Gini (World Bank): 28.8 (2011-12) → 25.5 (2022-23)
- India's income Gini (World Inequality Database): about 61-62
- World Inequality Report 2026: India's top 10% get about 58% of national income; bottom 50% about 15%
- Palma ratio = income share of top 10% ÷ income share of bottom 40% (José Gabriel Palma)
- Kuznets curve: inequality rises then falls with development (inverted U)
● Tracked since October 30, 2026 · last seen October 30, 2026 · updates as the daily brief publishes