Copernicus Climate Change Service (C3S)
The Copernicus Climate Change Service, or C3S, is the European Union's official service that tracks the Earth's climate. Every month it tells the world how hot the planet was, how warm the seas were, and how much sea ice and rain there was. Its monthly reports are among the first and most quoted signals of new temperature records. You can think of it as a thermometer and record book for the whole planet, kept by the EU and open to everyone for free.
Why does it exist?
Governments need reliable, regular facts about the climate to plan farming, water, disaster response and climate policy. Weather stations, ships, buoys and satellites all collect data, but each covers only some places and some years. Someone has to combine them into one complete and trusted picture. C3S does this job and makes the results free for scientists, governments and the public.
Where did it come from?
C3S is one part of a bigger EU programme called Copernicus.
- In 1998, a declaration called the Baveno Manifesto started a European Earth-observation plan named GMES (Global Monitoring for Environment and Security).
- In December 2012, GMES was renamed Copernicus, after the astronomer Nicolaus Copernicus.
- In 2014, the European Commission gave the job of running C3S to the European Centre for Medium-Range Weather Forecasts (ECMWF). ECMWF also runs the atmosphere service of Copernicus.
Who runs it?
The European Commission owns and funds Copernicus. The satellites, called Sentinels, are built by the European Space Agency (ESA). ECMWF runs C3S on behalf of the Commission. ECMWF is an independent international organisation set up in 1975 and supported by many European countries. It is not an EU agency. It has sites in Reading (UK), Bologna (Italy) and Bonn (Germany).
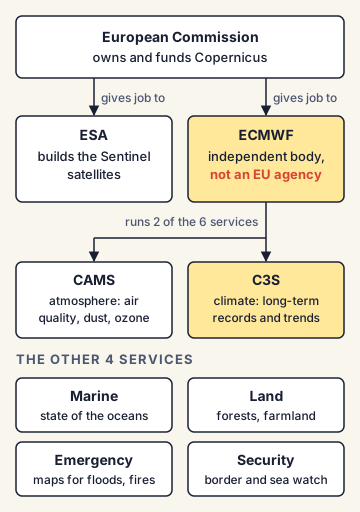
The six Copernicus services
Copernicus turns satellite and ground data into six main services:
- Atmosphere (Copernicus Atmosphere Monitoring Service, CAMS): air quality, dust, ozone.
- Marine: the state of the oceans.
- Land: forests, farmland, land use.
- Climate change (C3S): long-term climate records and trends.
- Emergency management: maps for floods, fires and earthquakes.
- Security: border and sea surveillance.
How does C3S work?
Its main tool is a reanalysis called ERA5.
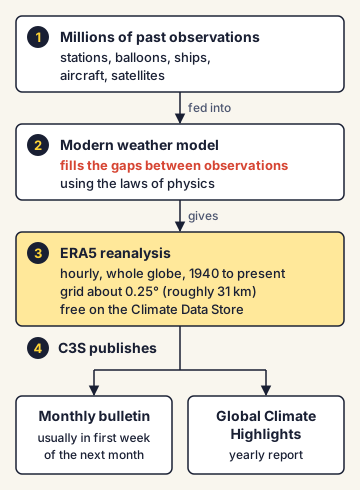
- Millions of past observations from stations, balloons, ships, aircraft and satellites are fed into a modern weather model.
- The model fills the gaps between observations using the laws of physics. The result is a complete map of the weather for every hour, across the whole globe.
- ERA5 gives hourly data from 1940 to the present, on a grid of about 0.25° (roughly 31 km). It is updated daily and is free on C3S's Climate Data Store.
- Using ERA5, C3S publishes a monthly climate bulletin, usually in the first week of the next month, and a yearly Global Climate Highlights report.
How does it describe temperature?
C3S usually gives two numbers for the same month:
- the anomaly against the recent 1991-2020 average (for example, +0.9°C for October 2026), and
- the rise above the pre-industrial 1850-1900 average (for example, +1.75°C). This second number is the one compared with the Paris Agreement's 1.5°C limit.
C3S is one of several global records
No single agency decides the world's temperature. The World Meteorological Organization (WMO) combines several datasets for its yearly State of the Global Climate report. These include ERA5 (C3S), JRA-3Q (Japan), GISTEMP (NASA, USA), NOAAGlobalTemp (NOAA, USA), HadCRUT5 (UK Met Office and University of East Anglia) and Berkeley Earth (USA). Their numbers differ slightly because each uses different data and methods.
India's position and Indian examples
In March 2018, the European Commission and India's Department of Space signed a cooperation arrangement in Bengaluru. Under it, India gets free, full and open access to Copernicus Sentinel satellite data. In return, data from Indian satellites like Oceansat-2, SCATSAT-1, SARAL, INSAT-3D and INSAT-3DR is shared on the Copernicus hub. In India, the India Meteorological Department (IMD) keeps the national temperature and rainfall records and issues India's own climate statements.
Commonly confused concepts
- C3S vs CAMS: Both are Copernicus services run by ECMWF. C3S tracks long-term climate (temperature, sea ice, rain). CAMS tracks the atmosphere's make-up (air pollution, dust, ozone, greenhouse gases).
- Copernicus vs Galileo: Both are EU space programmes. Copernicus watches the Earth. Galileo is a satellite navigation system, like the American GPS or India's NavIC.
- C3S vs IPCC: C3S measures what is happening now, month by month. The Intergovernmental Panel on Climate Change (IPCC) assesses all published science every few years and does not run its own measurements.
- ECMWF vs WMO: ECMWF is a European weather forecasting and research centre. WMO is the United Nations agency for weather and climate, with almost every country as a member.
- A month above 1.5°C vs breaching the Paris limit: C3S monthly numbers can go above 1.5°C, but the Paris limit refers to a long-term average, usually taken over about 20 years.
Issues, criticism and the way forward
- Gaps in observations: In poor regions, oceans and the poles there are fewer stations. Reanalysis fills these gaps with a model, which adds some uncertainty, especially for the early decades.
- Differences between datasets: C3S figures are often a little warmer or cooler than those of NASA or NOAA. This can confuse the public about whether a record was "really" broken. Scientists stress looking at all datasets together.
- Dependence on a few rich countries: Most global climate records are run by Europe, the US and Japan. Developing countries, including India, are building stronger national climate services and more open data to add their own view.
- Funding and continuity: Long climate records only work if they continue without breaks. Steady funding for satellites and ground stations is key, and sharing deals like the India-EU arrangement help keep the global record complete.
Concepts to Know
- Reanalysis: A complete, consistent record of past weather made by feeding old observations into a modern weather model. It is like rebuilding a full cricket scorecard from scattered notes using the rules of the game.
- Anomaly: How much a value differs from a normal or average value. A +0.9°C anomaly means 0.9°C warmer than the normal.
- Pre-industrial level: The average global temperature of 1850-1900, used as the "starting point" before large-scale burning of coal, oil and gas.
- Sea surface temperature (SST): The temperature of the top layer of the ocean.
- Earth observation: Collecting information about the Earth's land, water and air, mostly using satellites.
- C3S is part of the EU's Copernicus programme; run by ECMWF on behalf of the European Commission since 2014.
- Copernicus began as GMES (Baveno Manifesto, 1998); renamed Copernicus in December 2012.
- Copernicus has six core services: atmosphere (CAMS), marine, land, climate change (C3S), emergency management and security.
- ERA5 reanalysis: hourly data from 1940 to now, about 0.25° (around 31 km) grid; free on the Climate Data Store.
- Baselines used: 1991-2020 (recent normal) and 1850-1900 (pre-industrial).
- India-EU Copernicus data-sharing arrangement signed in Bengaluru on 19 March 2018.
- WMO combines several datasets (ERA5, JRA-3Q, GISTEMP, NOAAGlobalTemp, HadCRUT5, Berkeley Earth and others) for its yearly climate report.
● Tracked since March 10, 2026 · last seen November 06, 2026 · updates as the daily brief publishes