Air Pollution and Human Health
Measuring the Disease Burden
Air pollution harms health in many ways, from coughing and asthma to heart attacks, strokes and lung cancer. Scientists measure this harm through the "disease burden": how many deaths and how many years of healthy life can be linked to a cause like dirty air. These numbers do not come from death certificates. They come from careful statistical studies that compare how much pollution people breathe with how often they fall ill or die. Today, air pollution is counted among the biggest health risks in the world and in India.
Why do we need to measure it?
A government cannot fix a problem it cannot see. Death and disease estimates tell policymakers how serious air pollution is compared with other risks such as tobacco, high blood pressure or unsafe water. They help decide where to spend money, which cities and states need the most help, and whether a programme is working. They also turn an invisible problem into a number people can understand: "one in every five deaths" is easier to grasp than "PM2.5 of 41 µg/m³".
How does air pollution hurt the body?
When we breathe, fine particles like PM2.5 travel past the nose and throat into the tiny air sacs of the lungs. The smallest bits can pass into the blood. There they cause inflammation (the body's swelling and irritation response) and stress in blood vessels. Over years, this raises the risk of:
- Heart disease (especially ischaemic heart disease, where the heart's blood supply is reduced) and stroke
- Chronic obstructive pulmonary disease (COPD), a long-term lung disease that makes breathing hard
- Lung cancer
- Lower respiratory infections, such as pneumonia, which are especially deadly for young children
- Type 2 diabetes
- Harm to unborn babies, such as low birth weight and premature birth
Newer research also links air pollution to damage to the brain, such as dementia. Most deaths linked to air pollution in India are from such non-communicable diseases (diseases that do not spread from person to person).
Where did the counting come from?
The best-known method is the Global Burden of Disease (GBD) study. It began in the early 1990s with work for the World Bank's World Development Report 1993. Today it is led by the Institute for Health Metrics and Evaluation (IHME) at the University of Washington, USA, with thousands of researchers worldwide. It compares hundreds of diseases and risk factors across countries and years.
In India, the India State-Level Disease Burden Initiative, a joint effort of the Indian Council of Medical Research (ICMR), the Public Health Foundation of India and IHME, has used this method to give state-wise estimates.
How is the number calculated, step by step?
Think of it like working out how many road accidents are caused by speeding, even though no single crash report says "speeding alone killed this person".
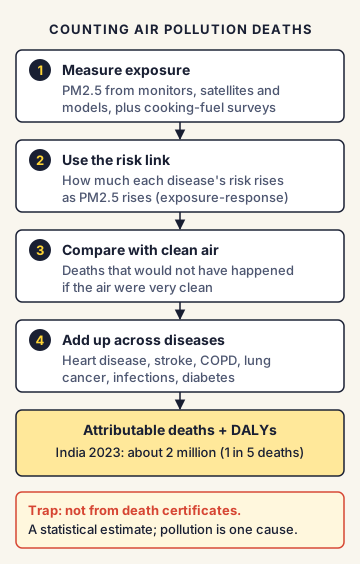
- Measure exposure: Scientists estimate how much PM2.5 people breathe, using ground monitors, satellites and computer models, plus surveys on how many homes cook with wood or dung.
- Use the risk link: From many studies across the world, they know how much the risk of each disease goes up as pollution rises. This is called the exposure-response relationship.
- Compare with a clean-air level: They ask, "How many deaths from heart disease, stroke, COPD and so on would not have happened if air were at a very clean level?"
- Add it up: The extra deaths across all linked diseases are called attributable deaths. They also count DALYs (years of healthy life lost through early death or illness).
So "2 million deaths due to air pollution" means: about 2 million deaths that would likely not have happened that year if people breathed clean air. Air pollution is usually one of several causes behind each of these deaths, along with smoking, diet or age.
What do the main estimates say?
- State of Global Air 2025 (by the Health Effects Institute with IHME): about 2 million deaths in India in 2023 were linked to air pollution, roughly one in five of all deaths. Worldwide, air pollution was linked to about 7.9 million deaths in 2023, about one in every eight deaths. India and China together made up more than half of these.
- India State-Level Disease Burden Initiative (published in The Lancet Planetary Health, December 2020): 1.67 million deaths in India in 2019, or 17.8% of all deaths. Of these, about 0.98 million were from outdoor particulate pollution and 0.61 million from household (indoor) air pollution. The economic loss from early deaths and illness was about 1.4% of India's GDP, or about ₹2.6 lakh crore (US$36.8 billion), in 2019.
- The same 2020 study found that from 1990 to 2019, the death rate from household air pollution fell by about 64%, but the death rate from outdoor particulate pollution rose by about 115%.
- Air Quality Life Index (AQLI) 2025, from the Energy Policy Institute at the University of Chicago: if India met the WHO PM2.5 guideline, the average Indian would live about 3.5 years longer. Meeting India's own standard of 40 µg/m³ would add about 1.5 years. In Delhi, the gain from meeting the WHO guideline would be about 8.2 years.
Outdoor vs household air pollution
There are two big sources of harmful air. Ambient (outdoor) air pollution comes from vehicles, industry, power plants, dust and crop burning. Household air pollution comes from cooking and heating with solid fuels such as wood, crop waste, dung and coal inside homes. Schemes that gave LPG connections to poor households, such as the Pradhan Mantri Ujjwala Yojana (launched in 2016), aim to cut household pollution, which hurts women and children most.
India's position and response
- India's main tools are the Air (Prevention and Control of Pollution) Act, 1981, the National Ambient Air Quality Standards (2009), the National Clean Air Programme (2019), the Commission for Air Quality Management for the Delhi-NCR region, and the Graded Response Action Plan (GRAP) for winter smog.
- The Union Health Ministry runs a National Programme on Climate Change and Human Health, which includes air pollution, and has issued health advisories on it.
- In replies in Parliament (for example in February and December 2025), Union ministers have said there is no conclusive data in India to establish a direct link between deaths and air pollution alone. They have said that health is affected by many factors, such as food habits, work, medical history, immunity and heredity, and that global studies use statistical models with limitations.
- Public health experts reply that no risk factor, including tobacco, is ever recorded as the "sole" cause on a death certificate. They say the statistical method is the accepted global way of counting such risks, and that India's own ICMR-backed study used it.
Commonly confused concepts
- Attributable deaths vs recorded deaths: Attributable deaths are statistical estimates of deaths linked to a risk. Recorded deaths are counted one by one on death certificates by medical cause (such as heart attack). Air pollution never appears as a cause on a certificate.
- Deaths vs DALYs: Deaths count lives lost. DALYs count total healthy years lost, including years lived with illness. A disease can cause few deaths but many DALYs.
- Ambient vs household air pollution: Ambient is outdoor air. Household is smoke inside homes from cooking or heating fuels. Both are counted separately in disease burden studies.
- GBD vs State of Global Air vs AQLI: GBD (IHME) is the core global health study. State of Global Air (Health Effects Institute) uses GBD data to report air pollution's health toll. AQLI (University of Chicago) estimates years of life expectancy lost due to PM2.5.
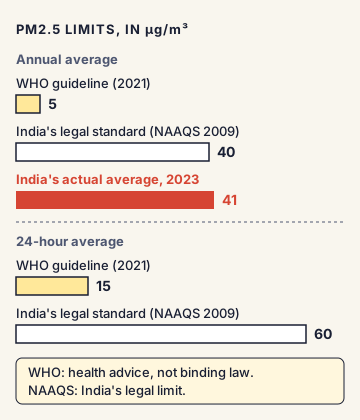
- NAAQS vs WHO guidelines: NAAQS are India's legal standards (PM2.5 annual limit 40 µg/m³). WHO guidelines are health-based advice, not binding law (PM2.5 annual guideline 5 µg/m³).
Issues, criticism and the way forward
- Data gap in India: India does not have a national system that tracks the health effects of air pollution over time, and many deaths are not medically certified. This makes it easy to question estimates and hard to plan.
- Uncertainty in models: Estimates come with ranges (for example, the 2020 study's 1.67 million had a range of 1.42 to 1.92 million). Critics note that much of the evidence on how pollution raises risk comes from countries with cleaner air. Supporters reply that newer studies, including Indian ones, show similar or stronger effects.
- Wrong yardstick: Programmes judged mainly by PM10 or by actions taken (such as kilometres of roads swept) may not reduce the PM2.5 that harms health. Many experts, and this report, suggest health-based PM2.5 targets.
- Pollution crosses borders: Air does not stop at city or state lines. Experts suggest managing pollution by airshed, a region that shares the same air, with states working together.
- Economic cost: Beyond deaths, air pollution reduces worker productivity, raises hospital bills and keeps tourists and investors away.
- Way forward: Commonly suggested steps include adding health-based PM2.5 targets to NCAP, building health surveillance at hospitals, expanding monitoring to small towns, tackling sources all year (not only in winter), cleaner fuels for homes, and linking funds to measurable outcomes.
Concepts to Know
- Disease burden: The total harm a disease or risk factor causes in a population, counted as deaths and years of healthy life lost.
- Attributable deaths: The number of deaths that would likely not have happened if a particular risk, such as air pollution, were removed.
- DALY (Disability-Adjusted Life Year): One DALY means one year of healthy life lost, either through dying early or living with illness or disability.
- µg/m³ (micrograms per cubic metre): The unit for measuring how much of a pollutant is in the air. A microgram is one-millionth of a gram.
- Non-communicable disease (NCD): A disease that does not spread from person to person, such as heart disease, stroke, diabetes or cancer.
- Airshed: An area where the air is shared and pollution moves around freely, often covering many cities or states.
- Exposure-response relationship: The link between how much of a pollutant people breathe and how much their risk of disease rises.
- GBD study: began early 1990s (World Development Report 1993); led by IHME, University of Washington
- State of Global Air 2025 (HEI and IHME): about 2 million air pollution deaths in India in 2023; 7.9 million worldwide (about 1 in 8 deaths)
- India State-Level Disease Burden Initiative (Lancet Planetary Health, Dec 2020): 1.67 million deaths in 2019 = 17.8% of all deaths; economic loss about 1.4% of GDP (US$36.8 billion)
- 1990-2019: household air pollution death rate down about 64%; outdoor particulate pollution death rate up about 115%
- AQLI 2025: India's average PM2.5 in 2023 = 41 µg/m³; meeting WHO guideline adds about 3.5 years of life; Delhi about 8.2 years
- NAAQS (2009) PM2.5: 40 annual / 60 (24-hour) µg/m³; WHO 2021: 5 annual / 15 (24-hour) µg/m³
- Pradhan Mantri Ujjwala Yojana (LPG for poor households): launched 2016
● Tracked since November 09, 2026 · last seen November 09, 2026 · updates as the daily brief publishes